
- Startseite >
- Flüsse >
- Wasserstand >
- Obere Donau >
- Freising >
- Jahresgrafik

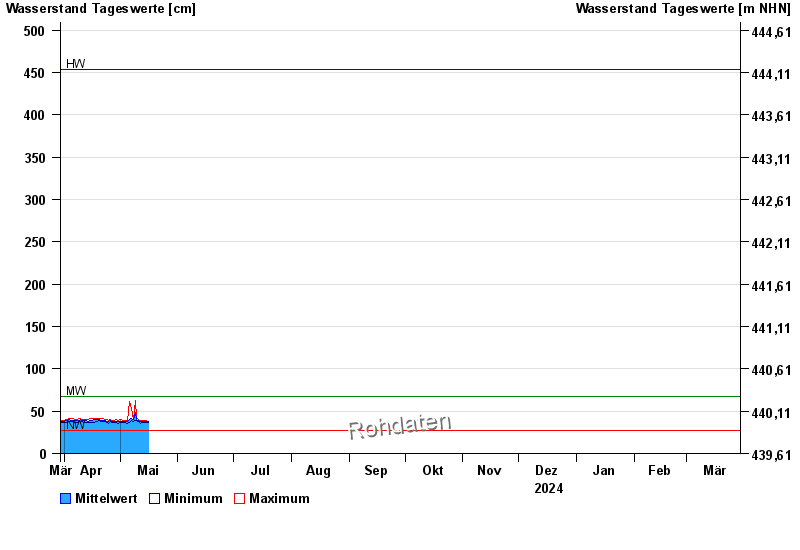
Jahresgrafik Freising / Isar
Wasserstand vom 30.03.2024 bis zum 29.03.2025
| Datum | Mittelwert [cm] | Maximum [cm] | Minimum [cm] |
|---|---|---|---|
| 29.04.2024 | 38 | 39 | 37 |
| 28.04.2024 | 38 | 39 | 37 |
| 27.04.2024 | 38 | 39 | 37 |
| 26.04.2024 | 39 | 40 | 38 |
| 25.04.2024 | 38 | 39 | 36 |
| 24.04.2024 | 38 | 40 | 37 |
| 23.04.2024 | 39 | 40 | 38 |
© Bayerisches Landesamt für Umwelt 2024