
- Startseite >
- Flüsse >
- Wasserstand >
- Obere Donau >
- Eichstätt >
- Jahresgrafik

Jahresgrafik Eichstätt / Altmühl
Wasserstand vom 06.03.2019 bis zum 05.03.2020
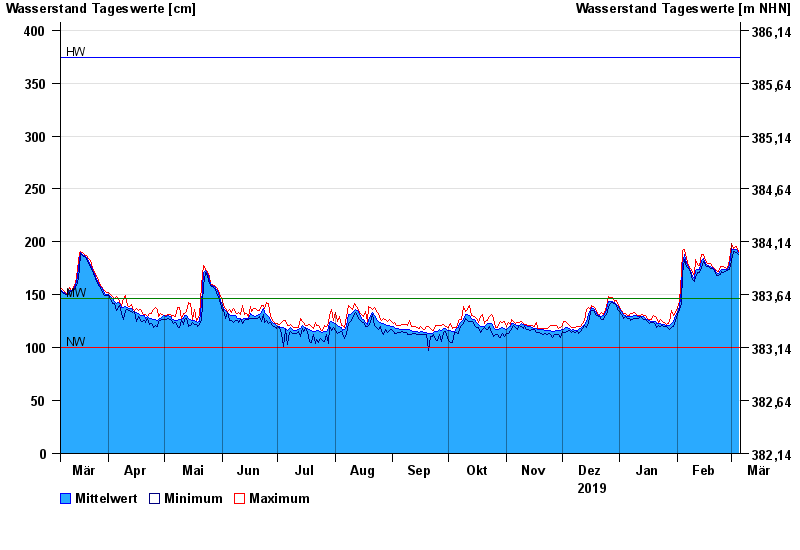
| Datum | Mittelwert [cm] | Maximum [cm] | Minimum [cm] |
|---|---|---|---|
| 05.03.2020 | 190 | 191 | 188 |
| 04.03.2020 | 193 | 196 | 190 |
| 03.03.2020 | 193 | 195 | 191 |
| 02.03.2020 | 193 | 194 | 191 |
| 01.03.2020 | 194 | 198 | 182 |
| 29.02.2020 | 178 | 182 | 174 |
| 28.02.2020 | 174 | 175 | 173 |
© Bayerisches Landesamt für Umwelt 2024