
- Startseite >
- Flüsse >
- Wasserstand >
- Obere Donau >
- Eichstätt >
- Jahresgrafik

Jahresgrafik Eichstätt / Altmühl
Wasserstand vom 13.04.2020 bis zum 12.04.2021
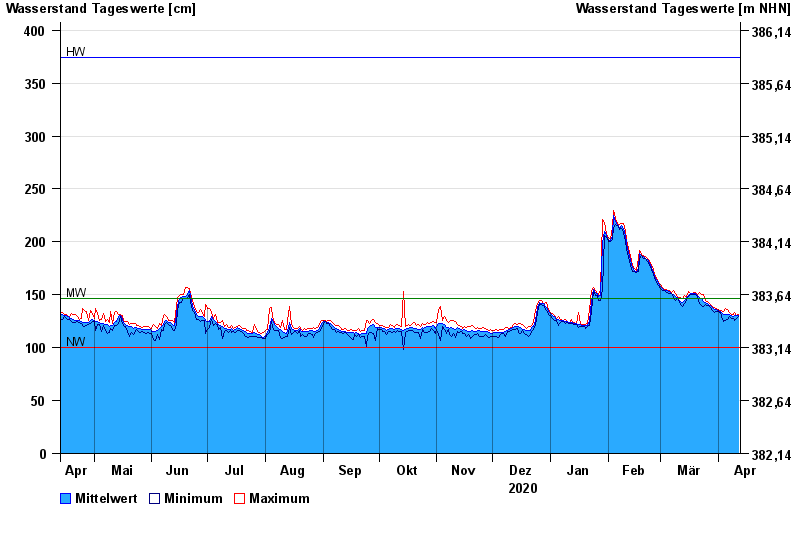
| Datum | Mittelwert [cm] | Maximum [cm] | Minimum [cm] |
|---|---|---|---|
| 12.04.2021 | 130 | 131 | 129 |
| 11.04.2021 | 130 | 130 | 128 |
| 10.04.2021 | 130 | 133 | 126 |
| 09.04.2021 | 129 | 131 | 128 |
| 08.04.2021 | 130 | 131 | 128 |
| 07.04.2021 | 131 | 133 | 129 |
| 06.04.2021 | 131 | 136 | 127 |
© Bayerisches Landesamt für Umwelt 2024