
- Startseite >
- Flüsse >
- Wasserstand >
- Obere Donau >
- Dillingen >
- Jahresgrafik

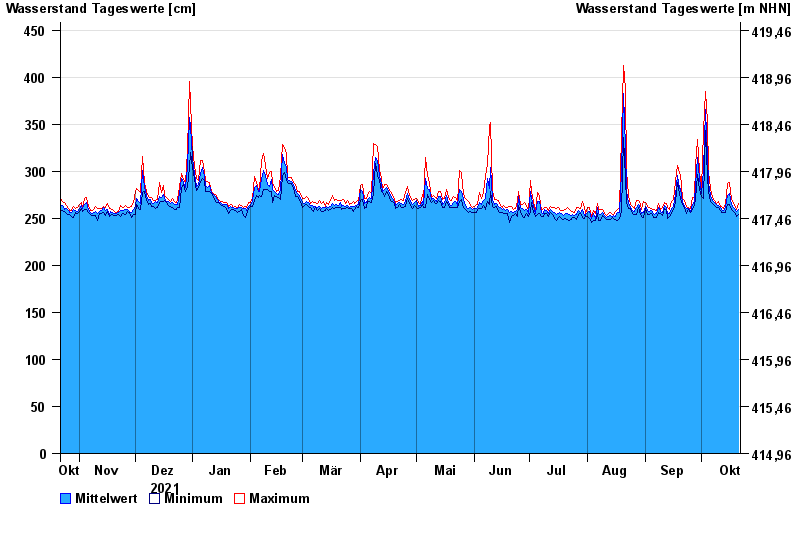
Jahresgrafik Dillingen / Donau
Wasserstand vom 22.10.2021 bis zum 21.10.2022
ACHTUNG!
Abflussermittlung bei Niedrigwasser beeinflusst.
- 24.05.1999 Wasserstand: 592 cm
- 06.02.1980 Wasserstand: 579 cm
- 13.08.2002 Wasserstand: 573 cm
- 30.09.1981 Wasserstand: 573 cm
- 24.08.2005 Wasserstand: 572 cm
| Datum | Mittelwert [cm] | Maximum [cm] | Minimum [cm] |
|---|---|---|---|
| 21.10.2022 | 259 | 266 | 254 |
| 20.10.2022 | 257 | 259 | 252 |
| 19.10.2022 | 260 | 264 | 256 |
| 18.10.2022 | 262 | 267 | 257 |
| 17.10.2022 | 265 | 270 | 259 |
| 16.10.2022 | 276 | 288 | 265 |
| 15.10.2022 | 274 | 287 | 265 |
© Bayerisches Landesamt für Umwelt 2024