
- Startseite >
- Flüsse >
- Wasserstand >
- Obere Donau >
- Deuerling >
- Monatsgrafik

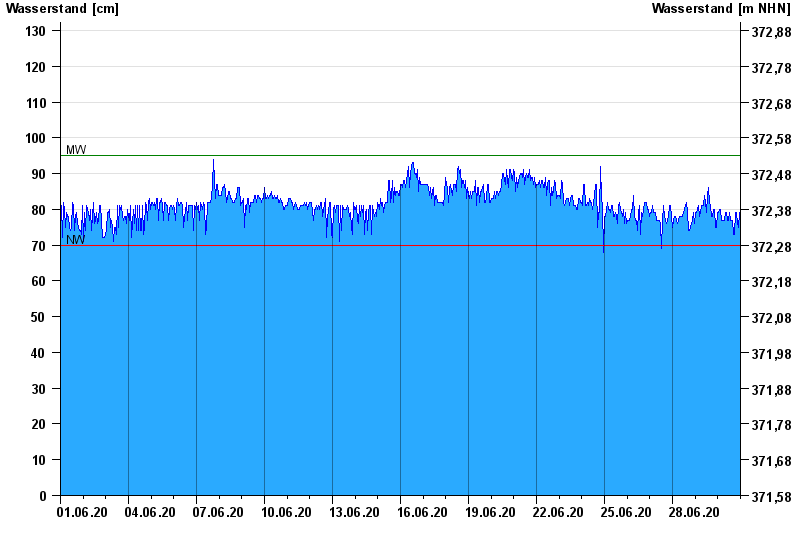
Monatsgrafik Deuerling / Schwarze Laber
Wasserstand vom 01.06.2020 bis zum 30.06.2020
| Datum | Wasserstand [cm] |
|---|---|
| 01.07.2020 00:45 | 79 |
| 01.07.2020 00:30 | 79 |
| 01.07.2020 00:15 | 78 |
| 01.07.2020 00:00 | 73 |
| 30.06.2020 23:45 | 74 |
| 30.06.2020 23:30 | 77 |
| 30.06.2020 23:15 | 79 |
© Bayerisches Landesamt für Umwelt 2024