
- Startseite >
- Flüsse >
- Wasserstand >
- Obere Donau >
- Blumenthal >
- Jahresgrafik

Jahresgrafik Blumenthal / Ecknach
Wasserstand vom 28.01.2019 bis zum 27.01.2020
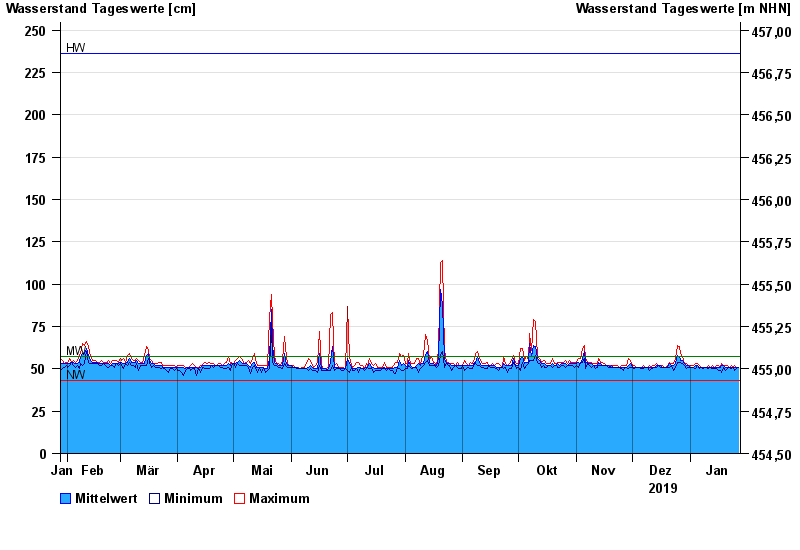
| Datum | Mittelwert [cm] | Maximum [cm] | Minimum [cm] |
|---|---|---|---|
| 27.01.2020 | 51 | 51 | 51 |
| 26.01.2020 | 51 | 51 | 50 |
| 25.01.2020 | 51 | 52 | 49 |
| 24.01.2020 | 51 | 51 | 51 |
| 23.01.2020 | 51 | 52 | 50 |
| 22.01.2020 | 51 | 51 | 51 |
| 21.01.2020 | 51 | 52 | 50 |
© Bayerisches Landesamt für Umwelt 2024