
- Startseite >
- Flüsse >
- Wasserstand >
- Obere Donau >
- Blumenthal >
- Jahresgrafik

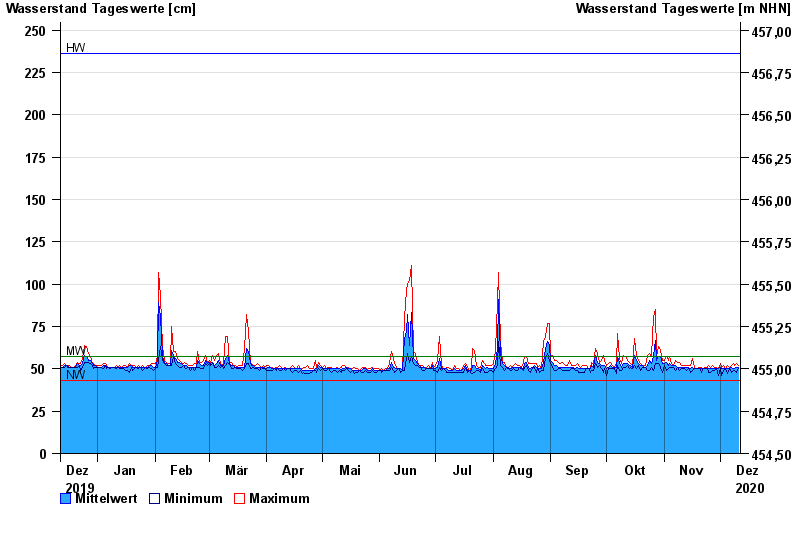
Jahresgrafik Blumenthal / Ecknach
Wasserstand vom 12.12.2019 bis zum 11.12.2020
| Datum | Mittelwert [cm] | Maximum [cm] | Minimum [cm] |
|---|---|---|---|
| 11.12.2020 | 51 | 52 | 50 |
| 10.12.2020 | 51 | 53 | 48 |
| 09.12.2020 | 50 | 52 | 49 |
| 08.12.2020 | 50 | 53 | 49 |
| 07.12.2020 | 51 | 52 | 48 |
| 06.12.2020 | 50 | 51 | 50 |
| 05.12.2020 | 50 | 52 | 47 |
© Bayerisches Landesamt für Umwelt 2024