
- Startseite >
- Flüsse >
- Wasserstand >
- Obere Donau >
- Binzwangen >
- Jahresgrafik

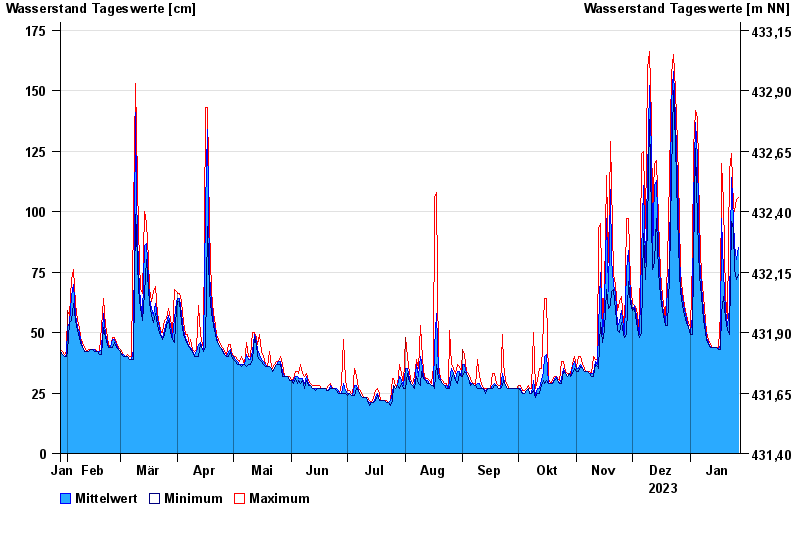
Jahresgrafik Binzwangen / Altmühl
Wasserstand vom 28.01.2023 bis zum 27.01.2024
Hinweis
Wasserstand und Abfluss wird zeitweise durch Biberdamm beeinflusst.
| Datum | Mittelwert [cm] | Maximum [cm] | Minimum [cm] |
|---|---|---|---|
| 27.01.2024 | 85 | 106 | 74 |
| 26.01.2024 | 80 | 105 | 72 |
| 25.01.2024 | 86 | 100 | 76 |
| 24.01.2024 | 96 | 102 | 93 |
| 23.01.2024 | 114 | 124 | 96 |
| 22.01.2024 | 60 | 117 | 49 |
| 21.01.2024 | 53 | 56 | 51 |
© Bayerisches Landesamt für Umwelt 2024