
- Startseite >
- Flüsse >
- Wasserstand >
- Obere Donau >
- Appolding >
- Jahresgrafik

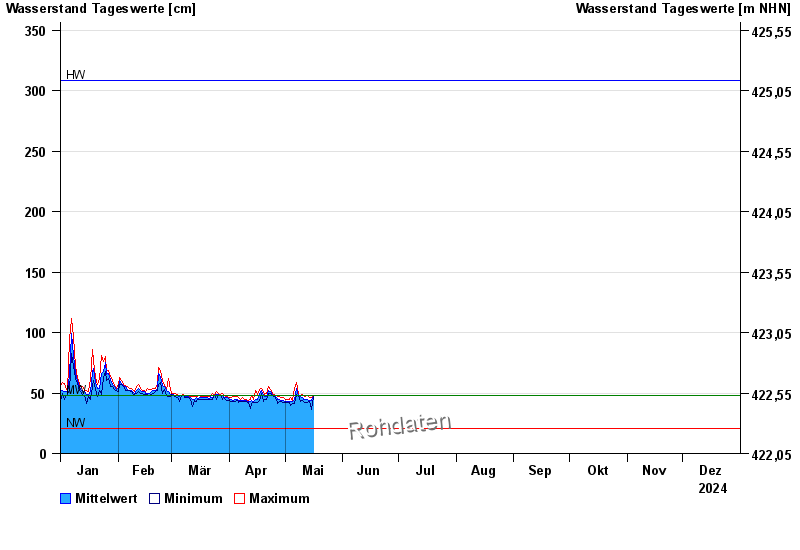
Jahresgrafik Appolding / Strogen
Wasserstand vom 01.01.2024 bis zum 31.12.2024
| Datum | Mittelwert [cm] | Maximum [cm] | Minimum [cm] |
|---|---|---|---|
| 27.07.2024 | 43 | 46 | 40 |
| 26.07.2024 | 45 | 47 | 43 |
| 25.07.2024 | 48 | 51 | 46 |
| 24.07.2024 | 50 | 53 | 47 |
| 23.07.2024 | 47 | 50 | 44 |
| 22.07.2024 | 45 | 47 | 40 |
| 21.07.2024 | 44 | 46 | 41 |
© Bayerisches Landesamt für Umwelt 2024