
- Startseite >
- Flüsse >
- Wasserstand >
- Obere Donau >
- Ansbach >
- Jahresgrafik

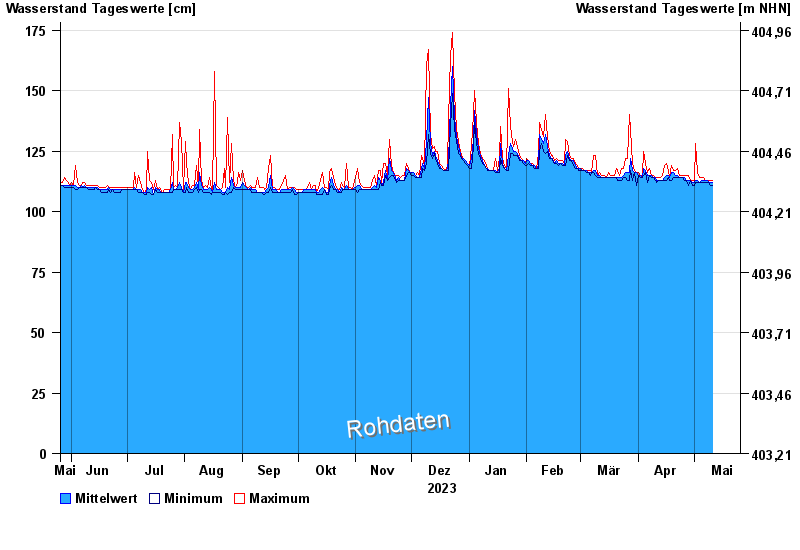
Jahresgrafik Ansbach / Hennenbach
Wasserstand vom 26.05.2023 bis zum 25.05.2024
 Für diesen Pegel sind keine historische Ereignisse hinterlegt.
| Datum | Mittelwert [cm] | Maximum [cm] | Minimum [cm] |
|---|---|---|---|
| 27.04.2024 | 114 | 115 | 113 |
| 26.04.2024 | 114 | 115 | 113 |
| 25.04.2024 | 114 | 115 | 114 |
| 24.04.2024 | 114 | 115 | 114 |
| 23.04.2024 | 114 | 115 | 114 |
| 22.04.2024 | 115 | 118 | 114 |
| 21.04.2024 | 115 | 117 | 114 |
© Bayerisches Landesamt für Umwelt 2024