
- Startseite >
- Flüsse >
- Wasserstand >
- Obere Donau >
- Ansbach >
- Jahresgrafik

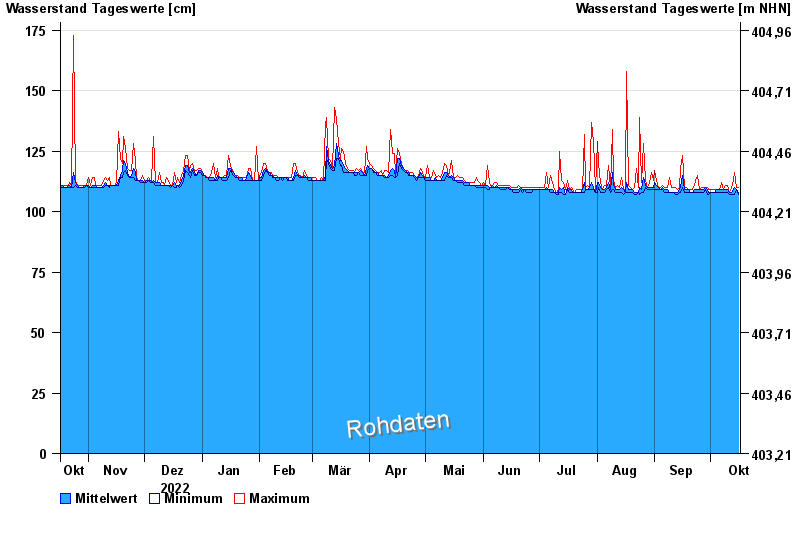
Jahresgrafik Ansbach / Hennenbach
Wasserstand vom 17.10.2022 bis zum 16.10.2023
 Für diesen Pegel sind keine historische Ereignisse hinterlegt.
| Datum | Mittelwert [cm] | Maximum [cm] | Minimum [cm] |
|---|---|---|---|
| 16.10.2023 | 108 | 110 | 107 |
| 15.10.2023 | 109 | 110 | 109 |
| 14.10.2023 | 110 | 116 | 107 |
| 13.10.2023 | 109 | 113 | 107 |
| 12.10.2023 | 108 | 110 | 107 |
| 11.10.2023 | 108 | 108 | 107 |
| 10.10.2023 | 109 | 111 | 108 |
© Bayerisches Landesamt für Umwelt 2024