
- Startseite >
- Flüsse >
- Wasserstand >
- Isar >
- Weilheim >
- Jahresgrafik

Jahresgrafik Weilheim / Ammer
Wasserstand vom 10.12.2019 bis zum 09.12.2020
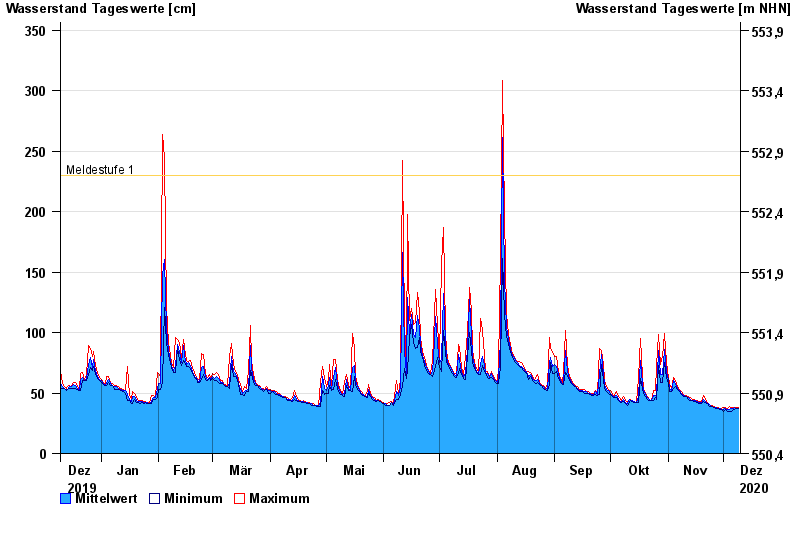
- Meldestufe 1 230 cm
- Meldestufe 3 370 cm
- Meldestufe 4 420 cm
- Hochwassergefahrenfläche HQ100 490 cm
| Datum | Mittelwert [cm] | Maximum [cm] | Minimum [cm] |
|---|---|---|---|
| 09.12.2020 | 37 | 38 | 37 |
| 08.12.2020 | 37 | 38 | 37 |
| 07.12.2020 | 38 | 38 | 36 |
| 06.12.2020 | 37 | 38 | 36 |
| 05.12.2020 | 37 | 38 | 35 |
| 04.12.2020 | 36 | 39 | 35 |
| 03.12.2020 | 36 | 37 | 35 |
© Bayerisches Landesamt für Umwelt 2024