
- Startseite >
- Flüsse >
- Wasserstand >
- Isar >
- Valley >
- Jahresgrafik

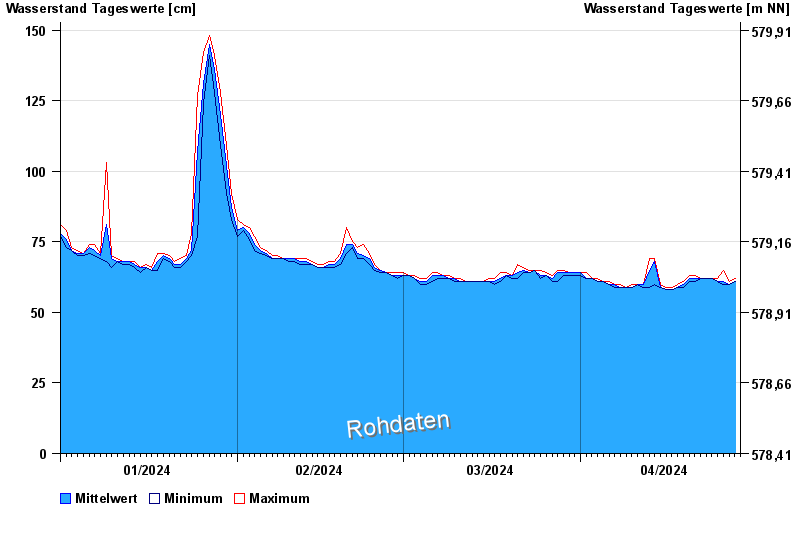
Jahresgrafik Valley / Mangfall
Wasserstand vom 01.01.2024 bis zum 28.04.2024
 Für diesen Pegel sind keine Hochwassermarken hinterlegt.
| Datum | Mittelwert [cm] | Maximum [cm] | Minimum [cm] |
|---|---|---|---|
| 28.04.2024 | 61 | 61 | 61 |
| 27.04.2024 | 60 | 61 | 60 |
| 26.04.2024 | 61 | 65 | 60 |
| 25.04.2024 | 61 | 62 | 61 |
| 24.04.2024 | 62 | 62 | 62 |
| 23.04.2024 | 62 | 62 | 62 |
| 22.04.2024 | 62 | 62 | 62 |
© Bayerisches Landesamt für Umwelt 2024