
- Startseite >
- Flüsse >
- Wasserstand >
- Isar >
- Starnberg >
- Jahresgrafik

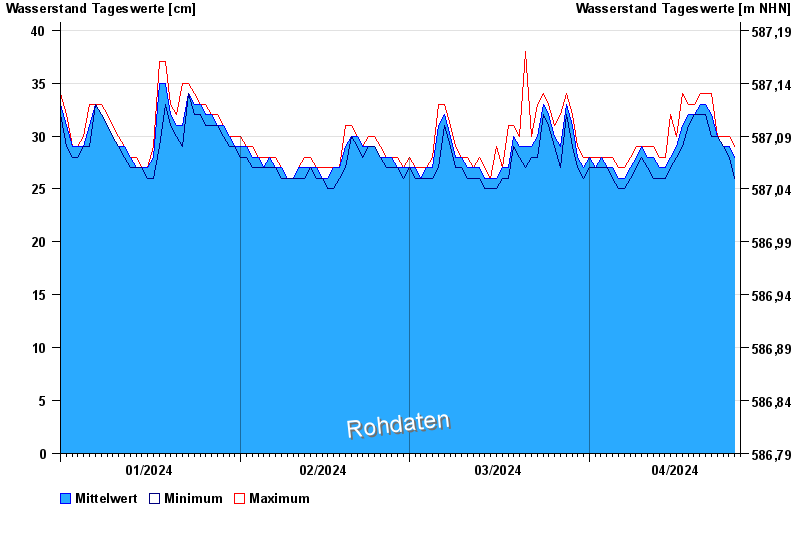
Jahresgrafik Starnberg / Georgenbach
Wasserstand vom 01.01.2024 bis zum 26.04.2024
- 22.05.1999 Wasserstand: 129 cm
- 03.06.2013 Wasserstand: 119 cm
- 18.06.1979 Wasserstand: 101 cm
- 07.08.2010 Wasserstand: 97 cm
- 22.08.2005 Wasserstand: 90 cm
| Datum | Mittelwert [cm] | Maximum [cm] | Minimum [cm] |
|---|---|---|---|
| 26.04.2024 | 28 | 29 | 26 |
| 25.04.2024 | 29 | 30 | 28 |
| 24.04.2024 | 29 | 30 | 29 |
| 23.04.2024 | 30 | 30 | 30 |
| 22.04.2024 | 32 | 34 | 30 |
| 21.04.2024 | 33 | 34 | 32 |
| 20.04.2024 | 33 | 34 | 32 |
© Bayerisches Landesamt für Umwelt 2024