
- Startseite >
- Flüsse >
- Wasserstand >
- Isar >
- Seebruck >
- Jahresgrafik

Jahresgrafik Seebruck / Alz
Wasserstand vom 21.09.2020 bis zum 20.09.2021
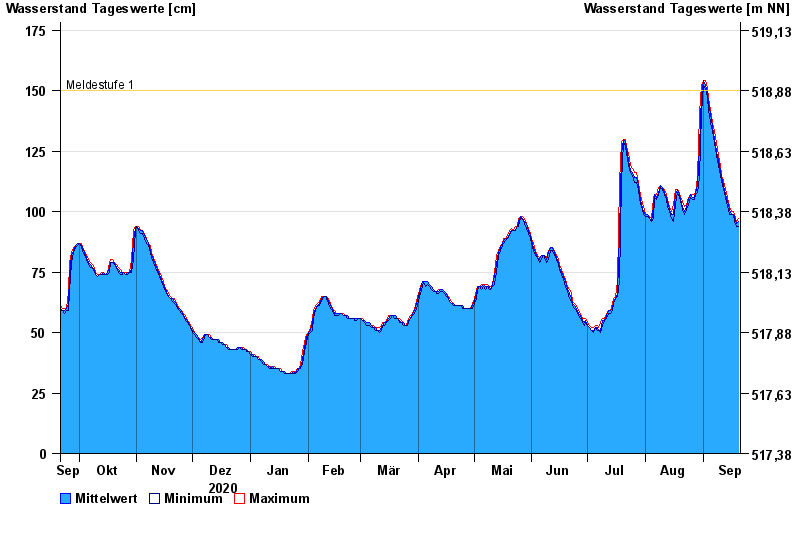
- Meldestufe 1 150 cm
- Meldestufe 2 180 cm
- Meldestufe 3 220 cm
- Meldestufe 4 240 cm
- Hochwassergefahrenfläche HQ100 260 cm
| Datum | Mittelwert [cm] | Maximum [cm] | Minimum [cm] |
|---|---|---|---|
| 20.09.2021 | 96 | 97 | 94 |
| 19.09.2021 | 95 | 96 | 94 |
| 18.09.2021 | 98 | 99 | 96 |
| 17.09.2021 | 99 | 100 | 99 |
| 16.09.2021 | 99 | 100 | 99 |
| 15.09.2021 | 101 | 102 | 99 |
| 14.09.2021 | 104 | 106 | 102 |
© Bayerisches Landesamt für Umwelt 2024