
- Startseite >
- Flüsse >
- Wasserstand >
- Isar >
- Seebruck >
- Jahresgrafik

Jahresgrafik Seebruck / Alz
Wasserstand vom 01.01.2023 bis zum 31.12.2023
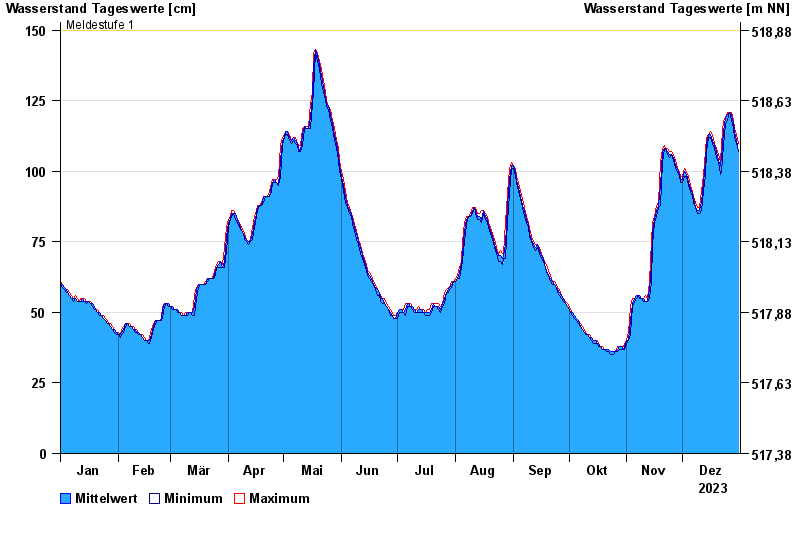
- Meldestufe 1 150 cm
- Meldestufe 2 180 cm
- Meldestufe 3 220 cm
- Meldestufe 4 240 cm
- Hochwassergefahrenfläche HQ100 260 cm
| Datum | Mittelwert [cm] | Maximum [cm] | Minimum [cm] |
|---|---|---|---|
| 31.12.2023 | 107 | 110 | 107 |
| 30.12.2023 | 111 | 113 | 110 |
| 29.12.2023 | 114 | 115 | 112 |
| 28.12.2023 | 117 | 118 | 115 |
| 27.12.2023 | 120 | 121 | 118 |
| 26.12.2023 | 121 | 121 | 121 |
| 25.12.2023 | 120 | 121 | 118 |
© Bayerisches Landesamt für Umwelt 2024