
- Startseite >
- Flüsse >
- Wasserstand >
- Isar >
- Seebruck >
- Jahresgrafik

Jahresgrafik Seebruck / Alz
Wasserstand vom 16.08.2021 bis zum 15.08.2022
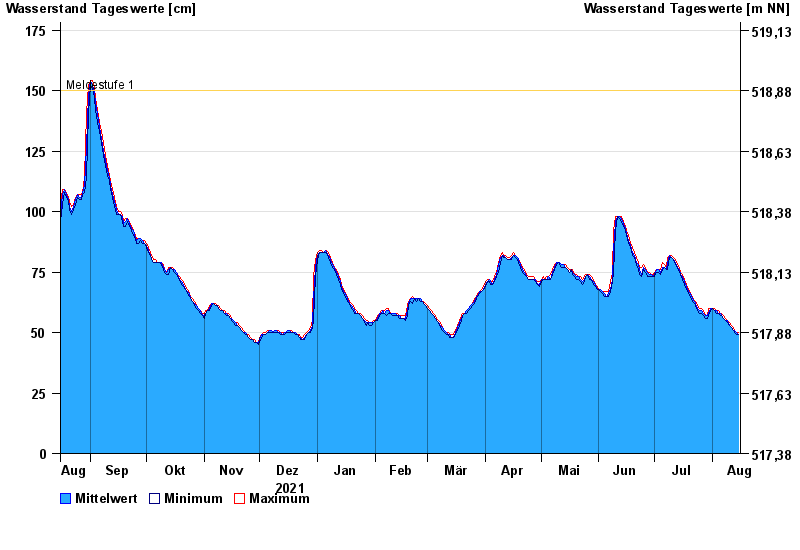
- Meldestufe 1 150 cm
- Meldestufe 2 180 cm
- Meldestufe 3 220 cm
- Meldestufe 4 240 cm
- Hochwassergefahrenfläche HQ100 260 cm
| Datum | Mittelwert [cm] | Maximum [cm] | Minimum [cm] |
|---|---|---|---|
| 15.08.2022 | 49 | 50 | 49 |
| 14.08.2022 | 50 | 50 | 49 |
| 13.08.2022 | 51 | 51 | 50 |
| 12.08.2022 | 51 | 52 | 51 |
| 11.08.2022 | 52 | 53 | 52 |
| 10.08.2022 | 53 | 54 | 53 |
| 09.08.2022 | 55 | 55 | 54 |
© Bayerisches Landesamt für Umwelt 2024