
- Startseite >
- Flüsse >
- Wasserstand >
- Isar >
- Seebruck >
- Jahresgrafik

Jahresgrafik Seebruck / Alz
Wasserstand vom 16.08.2019 bis zum 15.08.2020
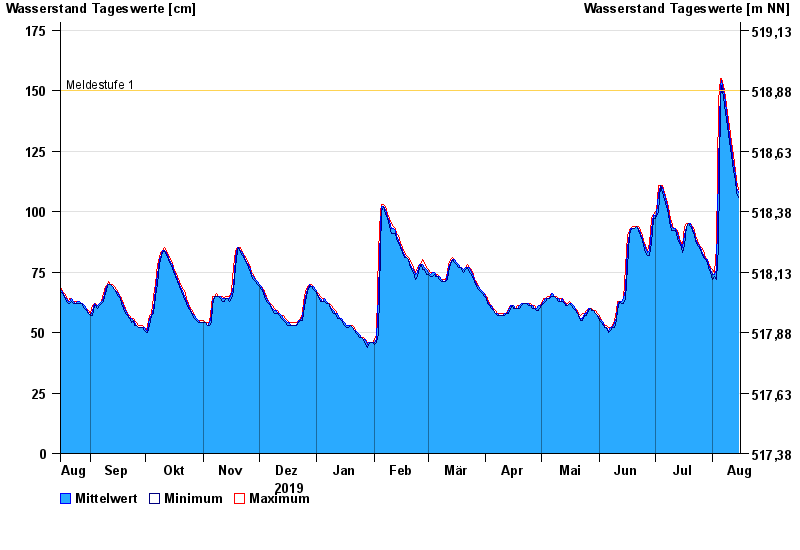
- Meldestufe 1 150 cm
- Meldestufe 2 180 cm
- Meldestufe 3 220 cm
- Meldestufe 4 240 cm
- Hochwassergefahrenfläche HQ100 260 cm
| Datum | Mittelwert [cm] | Maximum [cm] | Minimum [cm] |
|---|---|---|---|
| 15.08.2020 | 108 | 109 | 106 |
| 14.08.2020 | 110 | 113 | 108 |
| 13.08.2020 | 115 | 117 | 113 |
| 12.08.2020 | 120 | 123 | 117 |
| 11.08.2020 | 126 | 129 | 123 |
| 10.08.2020 | 132 | 135 | 129 |
| 09.08.2020 | 138 | 141 | 135 |
© Bayerisches Landesamt für Umwelt 2024