
- Startseite >
- Flüsse >
- Wasserstand >
- Isar >
- Schmerold >
- Monatsgrafik

Monatsgrafik Schmerold / Mangfall
Wasserstand vom 01.09.2020 bis zum 30.09.2020
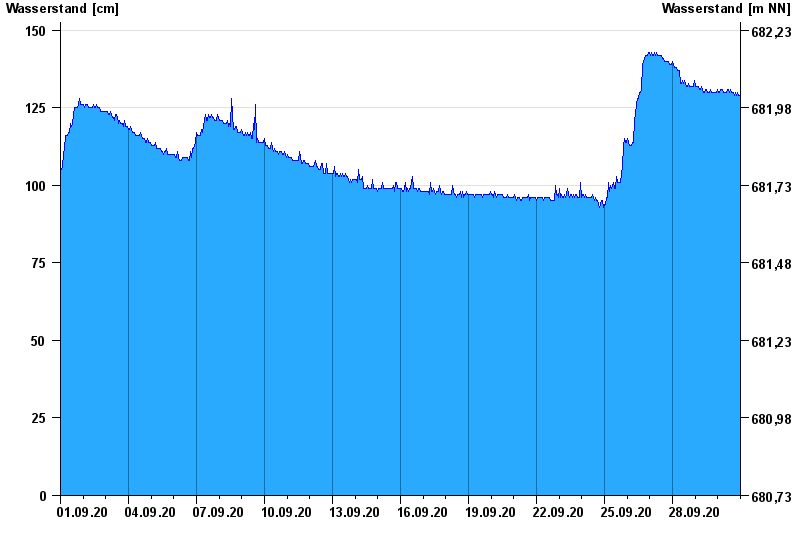
| Datum | Wasserstand [cm] |
|---|---|
| 01.10.2020 00:45 | 129 |
| 01.10.2020 00:30 | 128 |
| 01.10.2020 00:15 | 129 |
| 01.10.2020 00:00 | 129 |
| 30.09.2020 23:45 | 129 |
| 30.09.2020 23:30 | 129 |
| 30.09.2020 23:15 | 129 |
© Bayerisches Landesamt für Umwelt 2024