
- Startseite >
- Flüsse >
- Wasserstand >
- Isar >
- Schmerold >
- Monatsgrafik

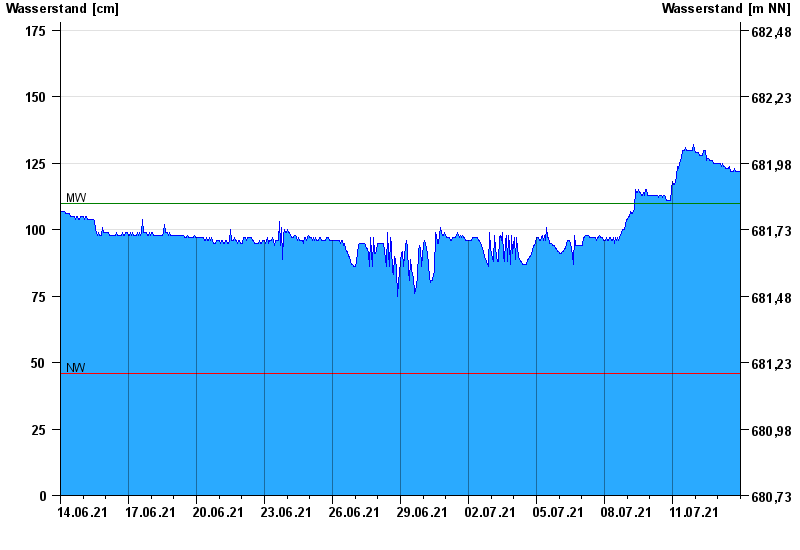
Monatsgrafik Schmerold / Mangfall
Wasserstand vom 14.06.2021 bis zum 13.07.2021
| Datum | Wasserstand [cm] |
|---|---|
| 14.07.2021 00:45 | 120 |
| 14.07.2021 00:30 | 120 |
| 14.07.2021 00:15 | 120 |
| 14.07.2021 00:00 | 121 |
| 13.07.2021 23:45 | 122 |
| 13.07.2021 23:30 | 120 |
| 13.07.2021 23:15 | 120 |
© Bayerisches Landesamt für Umwelt 2024