
- Startseite >
- Flüsse >
- Wasserstand >
- Isar >
- Rottach >
- Jahresgrafik

Jahresgrafik Rottach / Rottach
Wasserstand vom 29.03.2024 bis zum 28.03.2025
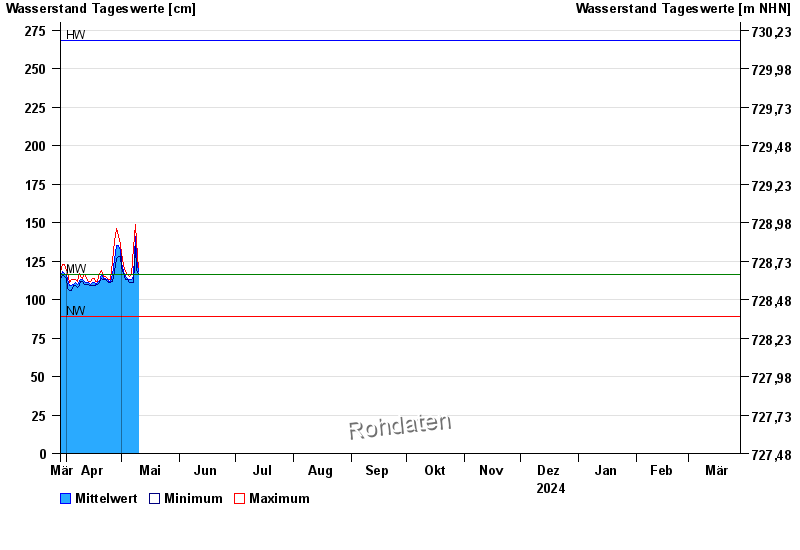
| Datum | Mittelwert [cm] | Maximum [cm] | Minimum [cm] |
|---|---|---|---|
| 10.05.2024 | 118 | 120 | 117 |
| 09.05.2024 | 126 | 138 | 119 |
| 08.05.2024 | 141 | 149 | 135 |
| 07.05.2024 | 115 | 134 | 111 |
| 06.05.2024 | 113 | 116 | 111 |
| 05.05.2024 | 113 | 115 | 111 |
| 04.05.2024 | 114 | 116 | 113 |
© Bayerisches Landesamt für Umwelt 2024