
- Startseite >
- Flüsse >
- Wasserstand >
- Isar >
- Rottach >
- Jahresgrafik

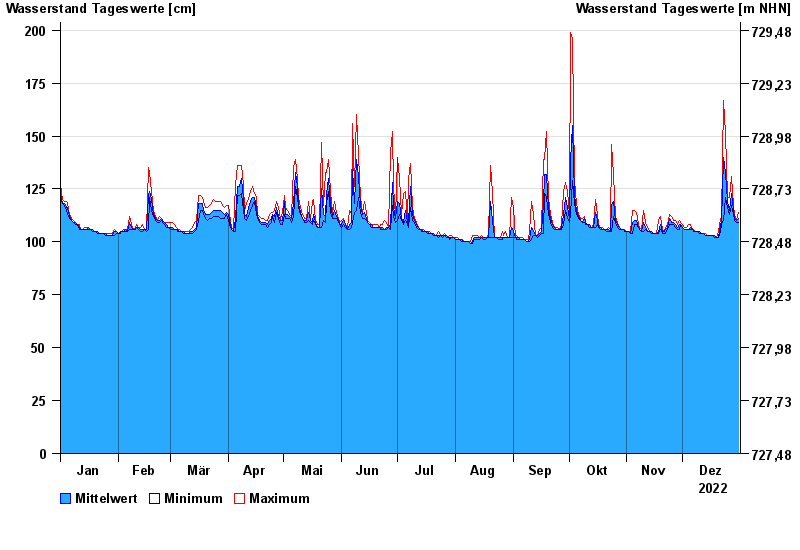
Jahresgrafik Rottach / Rottach
Wasserstand vom 01.01.2022 bis zum 31.12.2022
- 03.06.2010 Wasserstand: 268 cm
- 23.08.2005 Wasserstand: 266 cm
- 31.07.1977 Wasserstand: 261 cm
- 21.05.1999 Wasserstand: 259 cm
- 06.07.1997 Wasserstand: 252 cm
| Datum | Mittelwert [cm] | Maximum [cm] | Minimum [cm] |
|---|---|---|---|
| 31.12.2022 | 111 | 114 | 109 |
| 30.12.2022 | 110 | 110 | 109 |
| 29.12.2022 | 111 | 113 | 110 |
| 28.12.2022 | 115 | 117 | 113 |
| 27.12.2022 | 123 | 131 | 117 |
| 26.12.2022 | 115 | 121 | 113 |
| 25.12.2022 | 119 | 121 | 116 |
© Bayerisches Landesamt für Umwelt 2024