
- Startseite >
- Flüsse >
- Wasserstand >
- Isar >
- Prien >
- Jahresgrafik

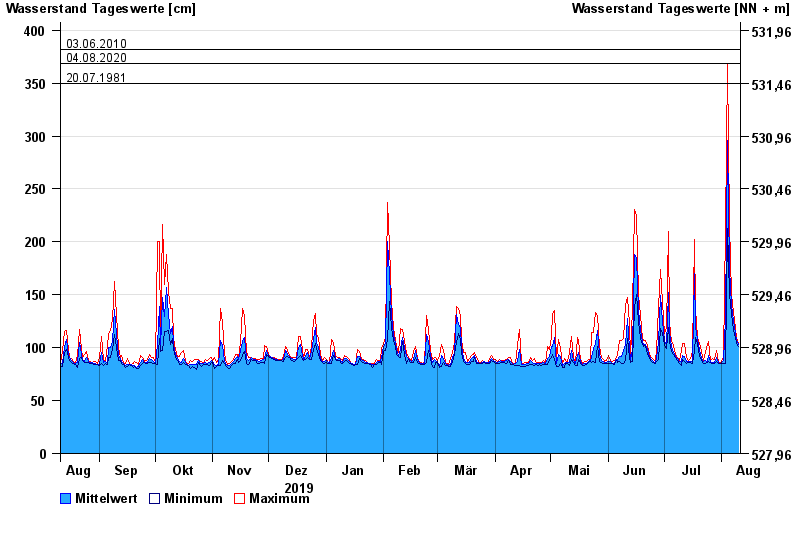
Jahresgrafik Prien / Prien
Wasserstand vom 11.08.2019 bis zum 10.08.2020
- 02.06.2013 Wasserstand: 422 cm
- 12.08.2002 Wasserstand: 419 cm
- 03.06.2010 Wasserstand: 382 cm
- 04.08.2020 Wasserstand: 369 cm
- 20.07.1981 Wasserstand: 350 cm
| Datum | Mittelwert [cm] | Maximum [cm] | Minimum [cm] |
|---|---|---|---|
| 10.08.2020 | 103 | 104 | 101 |
| 09.08.2020 | 107 | 110 | 104 |
| 08.08.2020 | 113 | 118 | 110 |
| 07.08.2020 | 125 | 133 | 116 |
| 06.08.2020 | 140 | 150 | 132 |
| 05.08.2020 | 174 | 216 | 150 |
| 04.08.2020 | 296 | 369 | 213 |
© Bayerisches Landesamt für Umwelt 2024