
- Startseite >
- Flüsse >
- Wasserstand >
- Isar >
- Plattling >
- Jahresgrafik

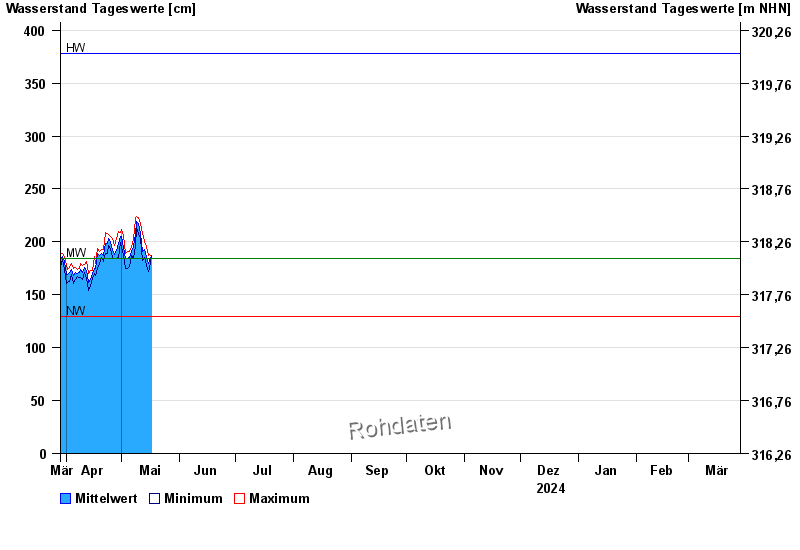
Jahresgrafik Plattling / Isar
Wasserstand vom 29.03.2024 bis zum 28.03.2025
| Datum | Mittelwert [cm] | Maximum [cm] | Minimum [cm] |
|---|---|---|---|
| 26.05.2024 | 210 | 212 | 205 |
| 25.05.2024 | 213 | 218 | 207 |
| 24.05.2024 | 207 | 215 | 197 |
| 23.05.2024 | 192 | 199 | 183 |
| 22.05.2024 | 196 | 200 | 190 |
| 21.05.2024 | 191 | 200 | 183 |
| 20.05.2024 | 189 | 196 | 182 |
© Bayerisches Landesamt für Umwelt 2024