
- Startseite >
- Flüsse >
- Wasserstand >
- Isar >
- Oberhausen >
- Jahresgrafik

Jahresgrafik Oberhausen / Ach
Wasserstand vom 01.01.2024 bis zum 31.12.2024
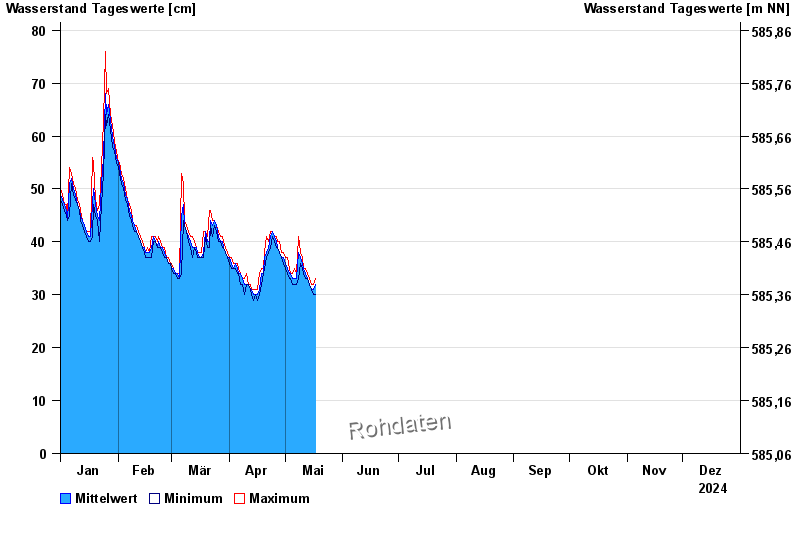
- Hochwassergefahrenfläche HQ100 236 cm
| Datum | Mittelwert [cm] | Maximum [cm] | Minimum [cm] |
|---|---|---|---|
| 16.05.2024 | 31 | 31 | 31 |
| 15.05.2024 | 31 | 32 | 31 |
| 14.05.2024 | 32 | 33 | 32 |
| 13.05.2024 | 33 | 34 | 33 |
| 12.05.2024 | 34 | 35 | 33 |
| 11.05.2024 | 35 | 35 | 34 |
| 10.05.2024 | 36 | 37 | 35 |
© Bayerisches Landesamt für Umwelt 2024