
- Startseite >
- Flüsse >
- Wasserstand >
- Isar >
- Oberach >
- Jahresgrafik

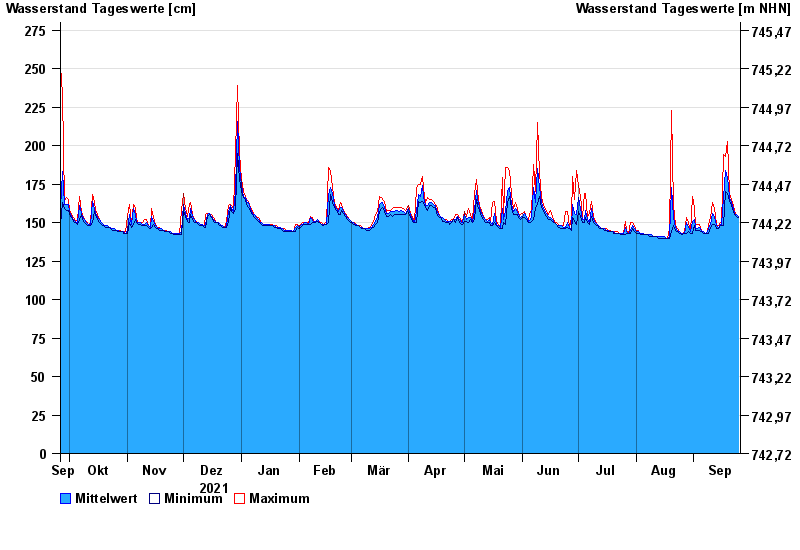
Jahresgrafik Oberach / Weißach
Wasserstand vom 26.09.2021 bis zum 25.09.2022
- Hochwassergefahrenfläche HQ100 320 cm
| Datum | Mittelwert [cm] | Maximum [cm] | Minimum [cm] |
|---|---|---|---|
| 25.09.2022 | 154 | 154 | 153 |
| 24.09.2022 | 155 | 155 | 154 |
| 23.09.2022 | 156 | 157 | 155 |
| 22.09.2022 | 159 | 161 | 157 |
| 21.09.2022 | 163 | 165 | 161 |
| 20.09.2022 | 166 | 169 | 164 |
| 19.09.2022 | 179 | 203 | 169 |
© Bayerisches Landesamt für Umwelt 2024