
- Startseite >
- Flüsse >
- Wasserstand >
- Isar >
- Landshut Birket >
- Jahresgrafik

Jahresgrafik Landshut Birket / Isar
Wasserstand vom 31.10.2021 bis zum 30.10.2022
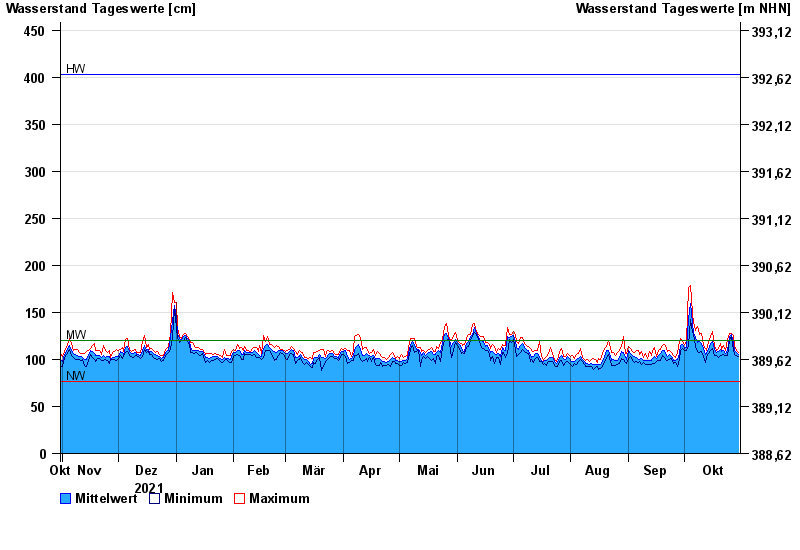
| Datum | Mittelwert [cm] | Maximum [cm] | Minimum [cm] |
|---|---|---|---|
| 30.10.2022 | 105 | 107 | 103 |
| 29.10.2022 | 107 | 110 | 104 |
| 28.10.2022 | 110 | 115 | 105 |
| 27.10.2022 | 117 | 125 | 110 |
| 26.10.2022 | 126 | 128 | 124 |
| 25.10.2022 | 124 | 128 | 120 |
| 24.10.2022 | 110 | 121 | 104 |
© Bayerisches Landesamt für Umwelt 2024