
- Startseite >
- Flüsse >
- Wasserstand >
- Isar >
- Landshut Birket >
- Jahresgrafik

Jahresgrafik Landshut Birket / Isar
Wasserstand vom 31.10.2020 bis zum 30.10.2021
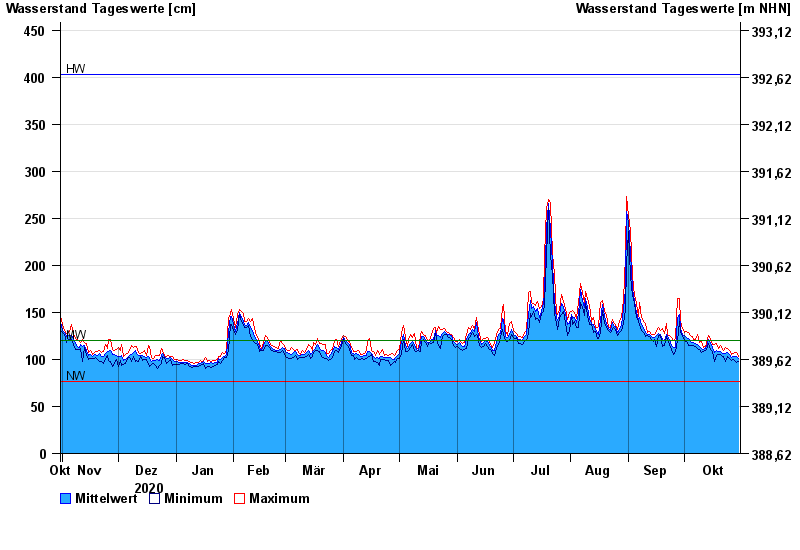
| Datum | Mittelwert [cm] | Maximum [cm] | Minimum [cm] |
|---|---|---|---|
| 30.10.2021 | 101 | 103 | 98 |
| 29.10.2021 | 103 | 107 | 97 |
| 28.10.2021 | 103 | 107 | 99 |
| 27.10.2021 | 103 | 106 | 100 |
| 26.10.2021 | 102 | 105 | 99 |
| 25.10.2021 | 105 | 109 | 101 |
| 24.10.2021 | 107 | 112 | 103 |
© Bayerisches Landesamt für Umwelt 2024