
- Startseite >
- Flüsse >
- Wasserstand >
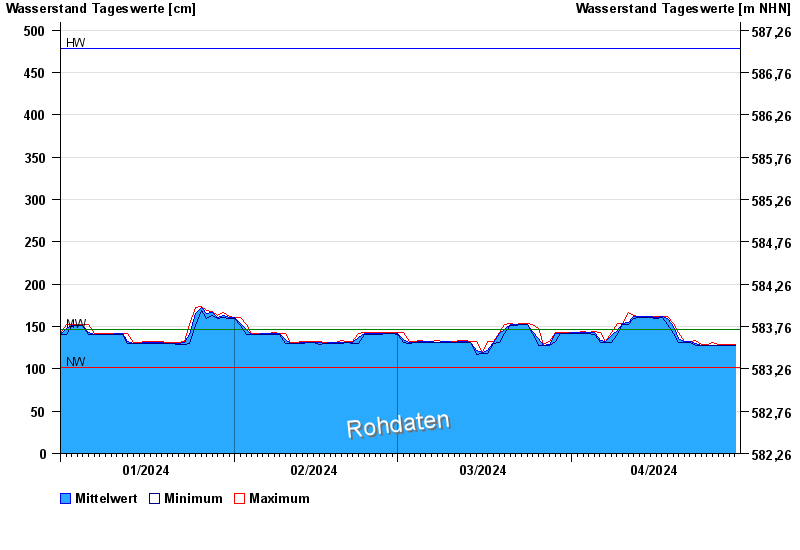
- Isar >
- Landsberg >
- Jahresgrafik

Jahresgrafik Landsberg / Lech
Wasserstand vom 01.01.2024 bis zum 30.04.2024
Hinweis
Messwerte beeinflusst durch Kraftwerkssteuerungen.
| Datum | Mittelwert [cm] | Maximum [cm] | Minimum [cm] |
|---|---|---|---|
| 30.04.2024 | 128 | 128 | 128 |
| 29.04.2024 | 128 | 129 | 127 |
| 28.04.2024 | 128 | 129 | 127 |
| 27.04.2024 | 128 | 129 | 127 |
| 26.04.2024 | 128 | 131 | 128 |
| 25.04.2024 | 128 | 129 | 128 |
| 24.04.2024 | 128 | 129 | 127 |
© Bayerisches Landesamt für Umwelt 2024