
- Startseite >
- Flüsse >
- Wasserstand >
- Isar >
- Kochel >
- Jahresgrafik

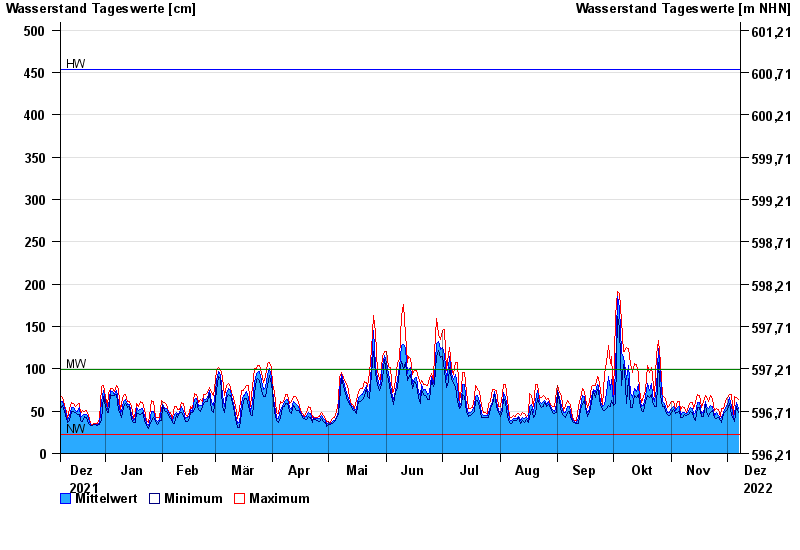
Jahresgrafik Kochel / Loisach
Wasserstand vom 08.12.2021 bis zum 07.12.2022
| Datum | Mittelwert [cm] | Maximum [cm] | Minimum [cm] |
|---|---|---|---|
| 07.12.2022 | 53 | 64 | 48 |
| 06.12.2022 | 60 | 66 | 55 |
| 05.12.2022 | 49 | 67 | 38 |
| 04.12.2022 | 42 | 45 | 41 |
| 03.12.2022 | 56 | 70 | 45 |
| 02.12.2022 | 66 | 70 | 59 |
| 01.12.2022 | 58 | 66 | 52 |
© Bayerisches Landesamt für Umwelt 2024