
- Startseite >
- Flüsse >
- Wasserstand >
- Isar >
- Inkofen >
- Jahresgrafik

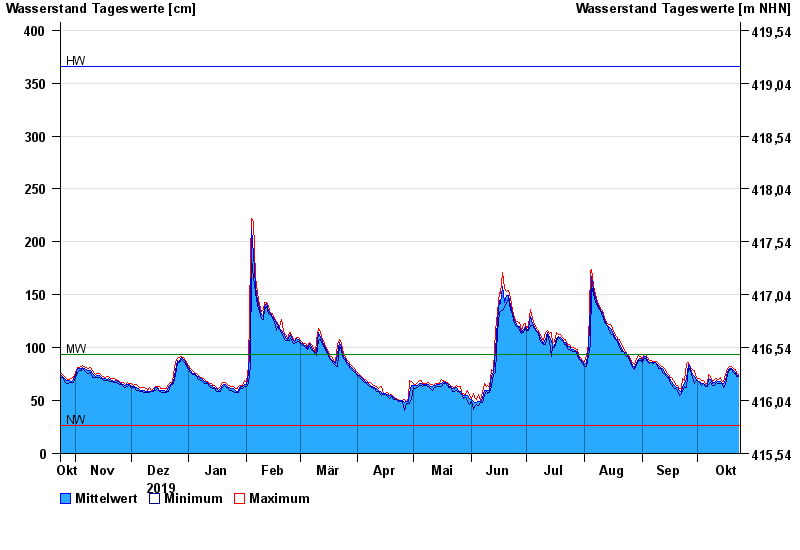
Jahresgrafik Inkofen / Amper
Wasserstand vom 24.10.2019 bis zum 23.10.2020
| Datum | Mittelwert [cm] | Maximum [cm] | Minimum [cm] |
|---|---|---|---|
| 23.10.2020 | 74 | 75 | 73 |
| 22.10.2020 | 75 | 77 | 73 |
| 21.10.2020 | 77 | 79 | 76 |
| 20.10.2020 | 78 | 80 | 77 |
| 19.10.2020 | 80 | 82 | 79 |
| 18.10.2020 | 80 | 82 | 79 |
| 17.10.2020 | 77 | 80 | 75 |
© Bayerisches Landesamt für Umwelt 2024