
- Startseite >
- Flüsse >
- Wasserstand >
- Isar >
- Hochberg >
- Jahresgrafik

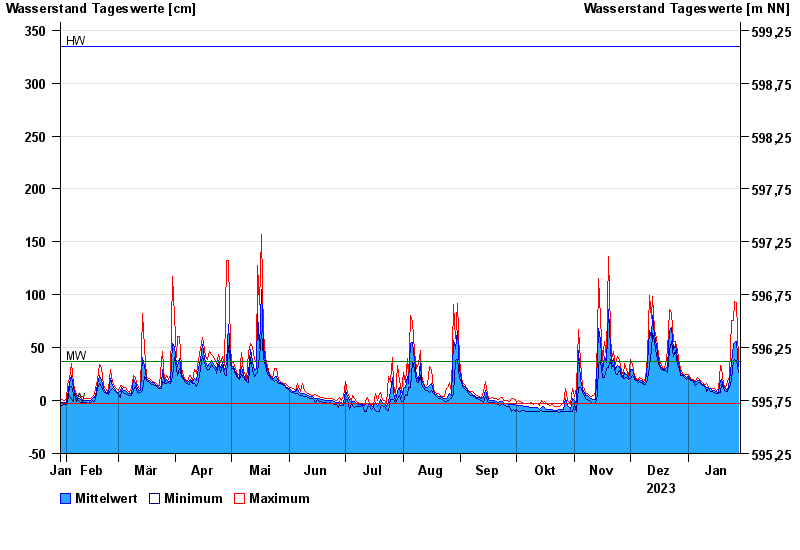
Jahresgrafik Hochberg / Traun
Wasserstand vom 29.01.2023 bis zum 28.01.2024
| Datum | Mittelwert [cm] | Maximum [cm] | Minimum [cm] |
|---|---|---|---|
| 28.01.2024 | 32 | 38 | 27 |
| 27.01.2024 | 56 | 93 | 38 |
| 26.01.2024 | 55 | 94 | 39 |
| 25.01.2024 | 53 | 76 | 38 |
| 24.01.2024 | 36 | 76 | 19 |
| 23.01.2024 | 19 | 23 | 12 |
| 22.01.2024 | 10 | 18 | 9 |
© Bayerisches Landesamt für Umwelt 2024