
- Startseite >
- Flüsse >
- Wasserstand >
- Isar >
- Hochberg >
- Jahresgrafik

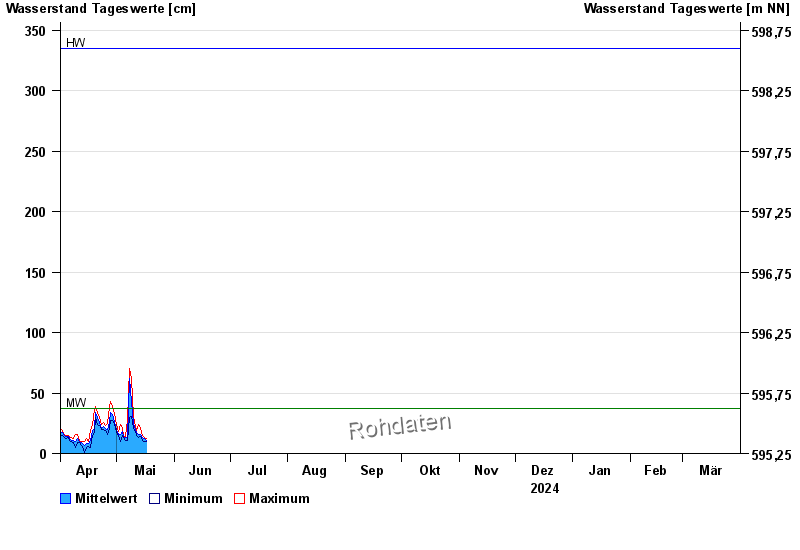
Jahresgrafik Hochberg / Traun
Wasserstand vom 01.04.2024 bis zum 31.03.2025
| Datum | Mittelwert [cm] | Maximum [cm] | Minimum [cm] |
|---|---|---|---|
| 17.05.2024 | 11 | 12 | 10 |
| 16.05.2024 | 12 | 13 | 10 |
| 15.05.2024 | 13 | 15 | 11 |
| 14.05.2024 | 16 | 21 | 14 |
| 13.05.2024 | 16 | 24 | 13 |
| 12.05.2024 | 17 | 19 | 15 |
| 11.05.2024 | 20 | 22 | 18 |
© Bayerisches Landesamt für Umwelt 2024