
- Startseite >
- Flüsse >
- Wasserstand >
- Isar >
- Hechendorf >
- Jahresgrafik

Jahresgrafik Hechendorf / Ramsach
Wasserstand vom 27.04.2024 bis zum 26.04.2025
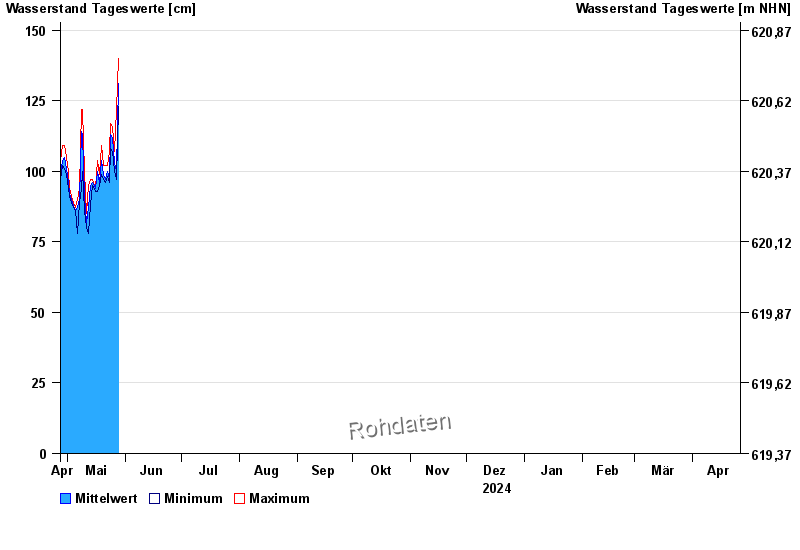
Hinweis
Messwerte beeinflusst durch Kraftwerkssteuerungen.
| Datum | Mittelwert [cm] | Maximum [cm] | Minimum [cm] |
|---|---|---|---|
| 07.05.2024 | 90 | 90 | 90 |
| 06.05.2024 | 87 | 90 | 78 |
| 05.05.2024 | 86 | 87 | 86 |
| 04.05.2024 | 88 | 89 | 87 |
| 03.05.2024 | 90 | 91 | 89 |
| 02.05.2024 | 92 | 94 | 91 |
| 01.05.2024 | 96 | 100 | 94 |
© Bayerisches Landesamt für Umwelt 2024