
- Startseite >
- Flüsse >
- Wasserstand >
- Isar >
- Garmisch u. d. Partnachmündung >
- Jahresgrafik

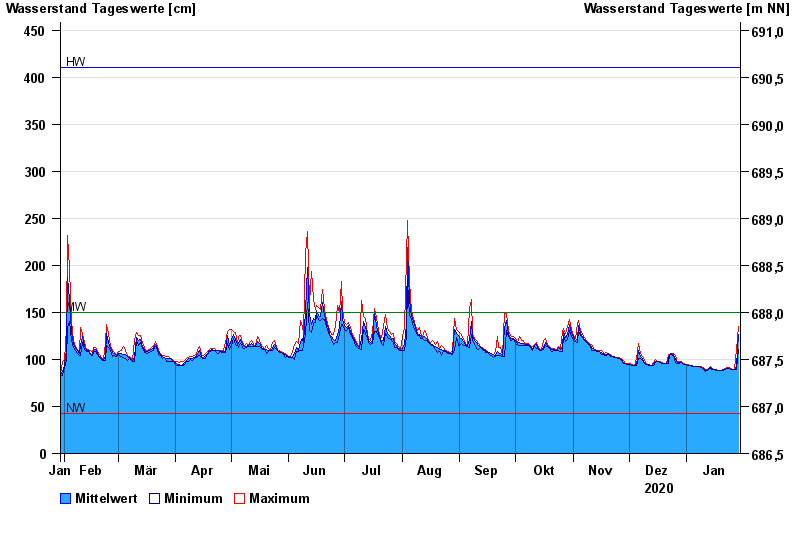
Jahresgrafik Garmisch u. d. Partnachmündung / Loisach
Wasserstand vom 30.01.2020 bis zum 29.01.2021
Hinweis
Messwerte beeinflusst durch Kraftwerkssteuerungen.
| Datum | Mittelwert [cm] | Maximum [cm] | Minimum [cm] |
|---|---|---|---|
| 29.01.2021 | 126 | 135 | 111 |
| 28.01.2021 | 92 | 111 | 89 |
| 27.01.2021 | 89 | 89 | 89 |
| 26.01.2021 | 89 | 89 | 89 |
| 25.01.2021 | 89 | 90 | 89 |
| 24.01.2021 | 90 | 91 | 90 |
| 23.01.2021 | 91 | 91 | 90 |
© Bayerisches Landesamt für Umwelt 2024