
- Startseite >
- Flüsse >
- Wasserstand >
- Isar >
- Garmisch u. d. Partnachmündung >
- Jahresgrafik

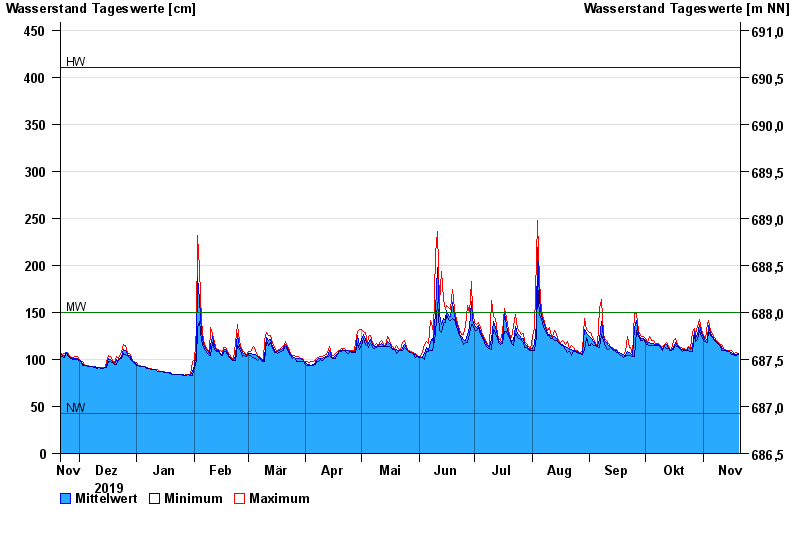
Jahresgrafik Garmisch u. d. Partnachmündung / Loisach
Wasserstand vom 21.11.2019 bis zum 20.11.2020
Hinweis
Messwerte beeinflusst durch Kraftwerkssteuerungen.
| Datum | Mittelwert [cm] | Maximum [cm] | Minimum [cm] |
|---|---|---|---|
| 20.11.2020 | 106 | 106 | 105 |
| 19.11.2020 | 105 | 107 | 104 |
| 18.11.2020 | 105 | 106 | 104 |
| 17.11.2020 | 106 | 107 | 105 |
| 16.11.2020 | 107 | 109 | 105 |
| 15.11.2020 | 108 | 109 | 108 |
| 14.11.2020 | 109 | 110 | 108 |
© Bayerisches Landesamt für Umwelt 2024