
- Startseite >
- Flüsse >
- Wasserstand >
- Isar >
- Garmisch u. d. Partnachmündung >
- Jahresgrafik

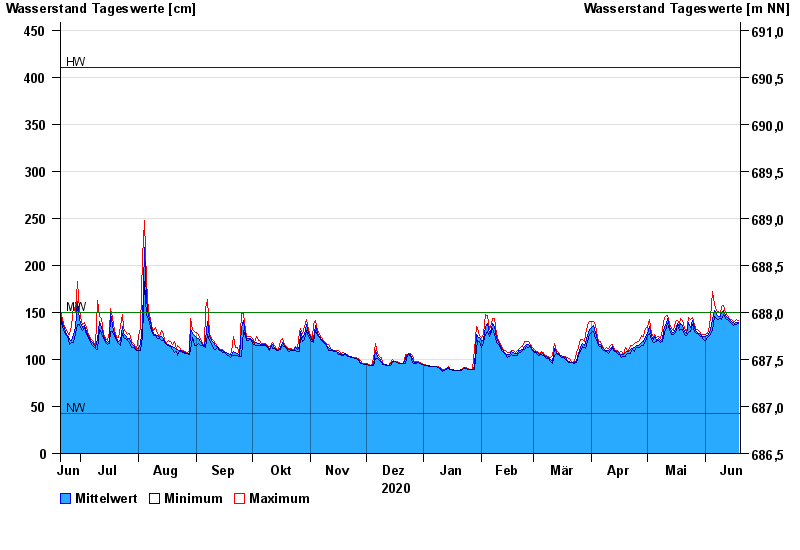
Jahresgrafik Garmisch u. d. Partnachmündung / Loisach
Wasserstand vom 20.06.2020 bis zum 19.06.2021
Hinweis
Messwerte beeinflusst durch Kraftwerkssteuerungen.
| Datum | Mittelwert [cm] | Maximum [cm] | Minimum [cm] |
|---|---|---|---|
| 19.06.2021 | 139 | 141 | 138 |
| 18.06.2021 | 139 | 142 | 137 |
| 17.06.2021 | 138 | 140 | 137 |
| 16.06.2021 | 139 | 140 | 136 |
| 15.06.2021 | 140 | 142 | 138 |
| 14.06.2021 | 142 | 144 | 140 |
| 13.06.2021 | 145 | 147 | 142 |
© Bayerisches Landesamt für Umwelt 2024