
- Startseite >
- Flüsse >
- Wasserstand >
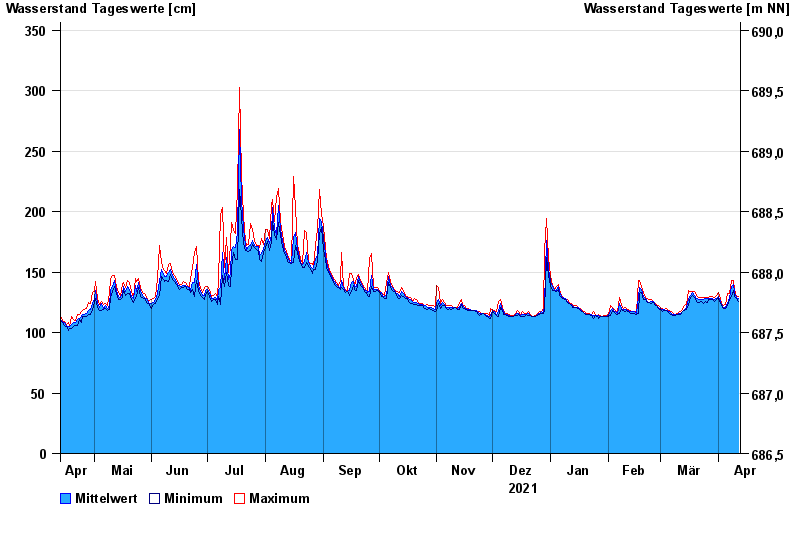
- Isar >
- Garmisch u. d. Partnachmündung >
- Jahresgrafik

Jahresgrafik Garmisch u. d. Partnachmündung / Loisach
Wasserstand vom 13.04.2021 bis zum 12.04.2022
Hinweis
Messwerte beeinflusst durch Kraftwerkssteuerungen.
| Datum | Mittelwert [cm] | Maximum [cm] | Minimum [cm] |
|---|---|---|---|
| 12.04.2022 | 128 | 130 | 126 |
| 11.04.2022 | 129 | 130 | 128 |
| 10.04.2022 | 133 | 136 | 130 |
| 09.04.2022 | 140 | 143 | 135 |
| 08.04.2022 | 138 | 143 | 130 |
| 07.04.2022 | 129 | 132 | 127 |
| 06.04.2022 | 124 | 132 | 122 |
© Bayerisches Landesamt für Umwelt 2024