
- Startseite >
- Flüsse >
- Wasserstand >
- Isar >
- Garmisch u. d. Partnachmündung >
- Jahresgrafik

Jahresgrafik Garmisch u. d. Partnachmündung / Loisach
Wasserstand vom 20.06.2022 bis zum 19.06.2023
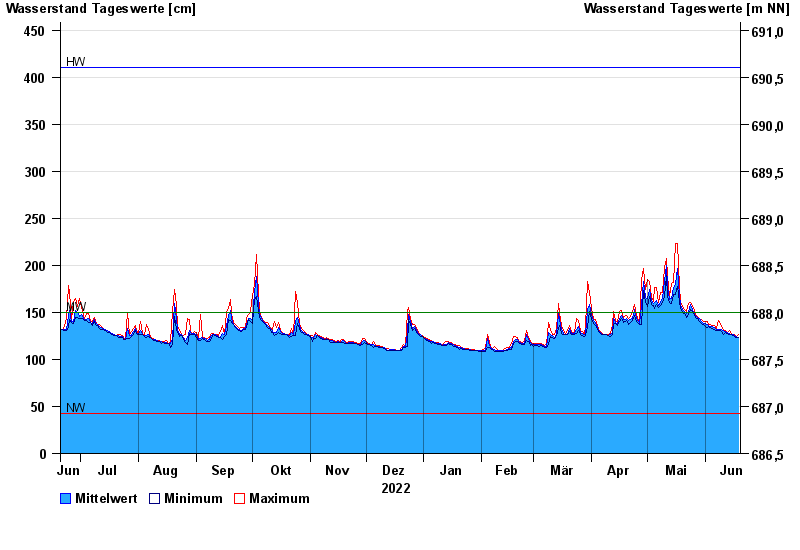
Hinweis
Messwerte beeinflusst durch Kraftwerkssteuerungen.
| Datum | Mittelwert [cm] | Maximum [cm] | Minimum [cm] |
|---|---|---|---|
| 19.06.2023 | 123 | 127 | 123 |
| 18.06.2023 | 124 | 124 | 123 |
| 17.06.2023 | 125 | 126 | 124 |
| 16.06.2023 | 126 | 127 | 125 |
| 15.06.2023 | 127 | 128 | 126 |
| 14.06.2023 | 128 | 131 | 126 |
| 13.06.2023 | 129 | 129 | 128 |
© Bayerisches Landesamt für Umwelt 2024