
- Startseite >
- Flüsse >
- Wasserstand >
- Isar >
- Farchant >
- Jahresgrafik

Jahresgrafik Farchant / Loisach
Wasserstand vom 17.04.2024 bis zum 16.04.2025
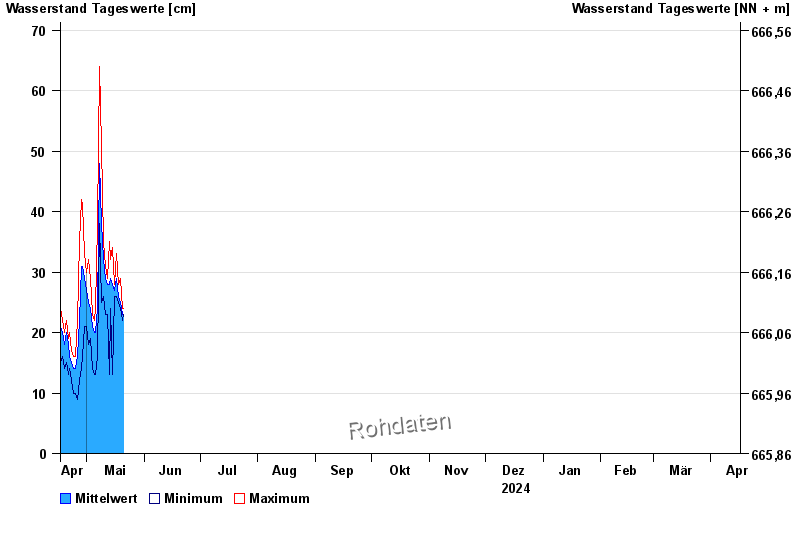
Hinweis
Messwerte beeinflusst durch Kraftwerkssteuerungen und Kiesanladungen. Kiesumlagerungen bewirkt Trockenlegung der Messinstrumente ab 12.12.2022
- 22.05.1999 Wasserstand: 295 cm
- 10.08.1970 Wasserstand: 274 cm
- 20.07.1981 Wasserstand: 267 cm
- 01.08.1977 Wasserstand: 265 cm
- 11.06.1965 Wasserstand: 259 cm
| Datum | Mittelwert [cm] | Maximum [cm] | Minimum [cm] |
|---|---|---|---|
| 30.04.2024 | 33 | 34 | 32 |
| 29.04.2024 | 31 | 41 | 16 |
| 28.04.2024 | 31 | 42 | 14 |
| 27.04.2024 | 22 | 35 | 12 |
| 26.04.2024 | 16 | 22 | 9 |
| 25.04.2024 | 14 | 16 | 10 |
| 24.04.2024 | 14 | 16 | 10 |
© Bayerisches Landesamt für Umwelt 2024