
- Startseite >
- Flüsse >
- Wasserstand >
- Isar >
- Eschenlohe Brücke >
- Jahresgrafik

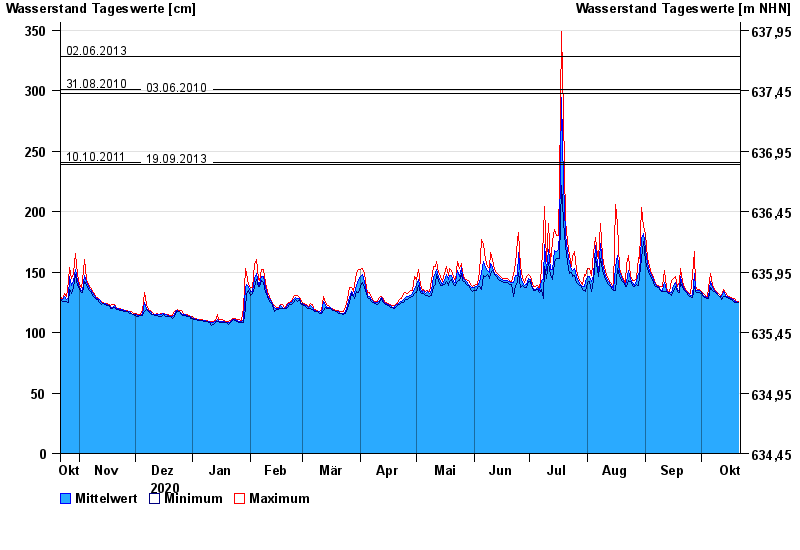
Jahresgrafik Eschenlohe Brücke / Loisach
Wasserstand vom 22.10.2020 bis zum 21.10.2021
Hinweis
Messwerte beeinflusst durch Kraftwerkssteuerungen.
- 02.06.2013 Wasserstand: 328 cm
- 31.08.2010 Wasserstand: 301 cm
- 03.06.2010 Wasserstand: 298 cm
- 10.10.2011 Wasserstand: 241 cm
- 19.09.2013 Wasserstand: 239 cm
| Datum | Mittelwert [cm] | Maximum [cm] | Minimum [cm] |
|---|---|---|---|
| 21.10.2021 | 125 | 126 | 125 |
| 20.10.2021 | 126 | 126 | 125 |
| 19.10.2021 | 126 | 128 | 125 |
| 18.10.2021 | 127 | 128 | 126 |
| 17.10.2021 | 128 | 129 | 127 |
| 16.10.2021 | 129 | 130 | 128 |
| 15.10.2021 | 130 | 131 | 129 |
© Bayerisches Landesamt für Umwelt 2024