
- Startseite >
- Flüsse >
- Wasserstand >
- Isar >
- Eschenlohe Brücke >
- Jahresgrafik

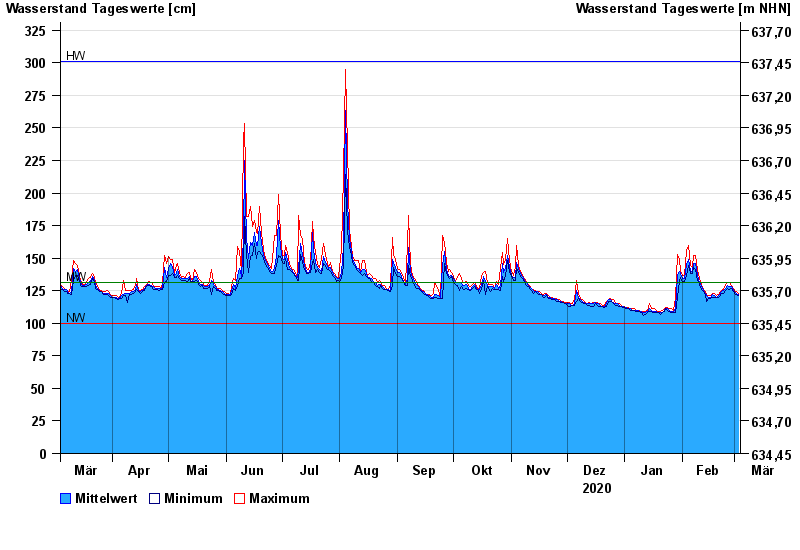
Jahresgrafik Eschenlohe Brücke / Loisach
Wasserstand vom 04.03.2020 bis zum 03.03.2021
Hinweis
Messwerte beeinflusst durch Kraftwerkssteuerungen.
| Datum | Mittelwert [cm] | Maximum [cm] | Minimum [cm] |
|---|---|---|---|
| 03.03.2021 | 122 | 123 | 121 |
| 02.03.2021 | 123 | 124 | 122 |
| 01.03.2021 | 124 | 125 | 123 |
| 28.02.2021 | 125 | 127 | 124 |
| 27.02.2021 | 128 | 129 | 127 |
| 26.02.2021 | 128 | 131 | 126 |
| 25.02.2021 | 129 | 131 | 127 |
© Bayerisches Landesamt für Umwelt 2024