
- Startseite >
- Flüsse >
- Wasserstand >
- Isar >
- Eschenlohe Brücke >
- Jahresgrafik

Jahresgrafik Eschenlohe Brücke / Loisach
Wasserstand vom 01.01.2024 bis zum 27.04.2024
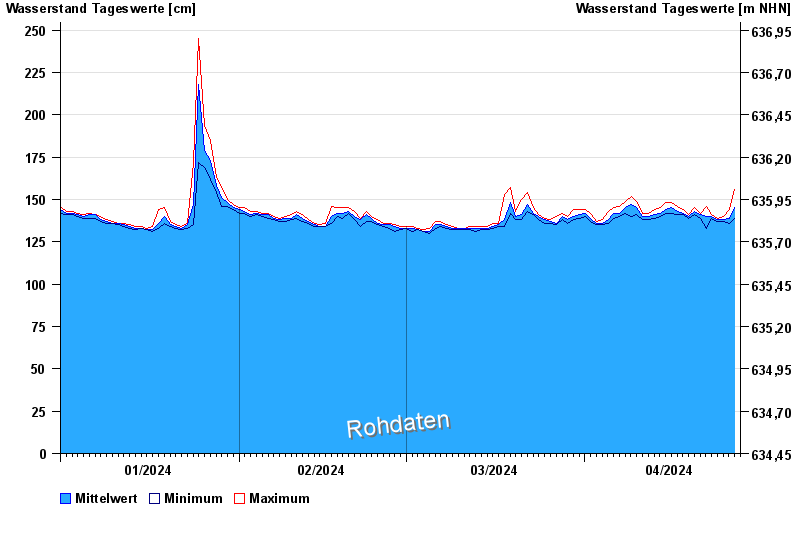
Hinweis
Messwerte beeinflusst durch Kraftwerkssteuerungen.
| Datum | Mittelwert [cm] | Maximum [cm] | Minimum [cm] |
|---|---|---|---|
| 27.04.2024 | 144 | 144 | 143 |
| 26.04.2024 | 139 | 144 | 136 |
| 25.04.2024 | 138 | 140 | 137 |
| 24.04.2024 | 138 | 139 | 137 |
| 23.04.2024 | 140 | 141 | 139 |
| 22.04.2024 | 140 | 146 | 133 |
| 21.04.2024 | 141 | 142 | 139 |
© Bayerisches Landesamt für Umwelt 2024