
- Startseite >
- Flüsse >
- Wasserstand >
- Isar >
- Erb >
- Jahresgrafik

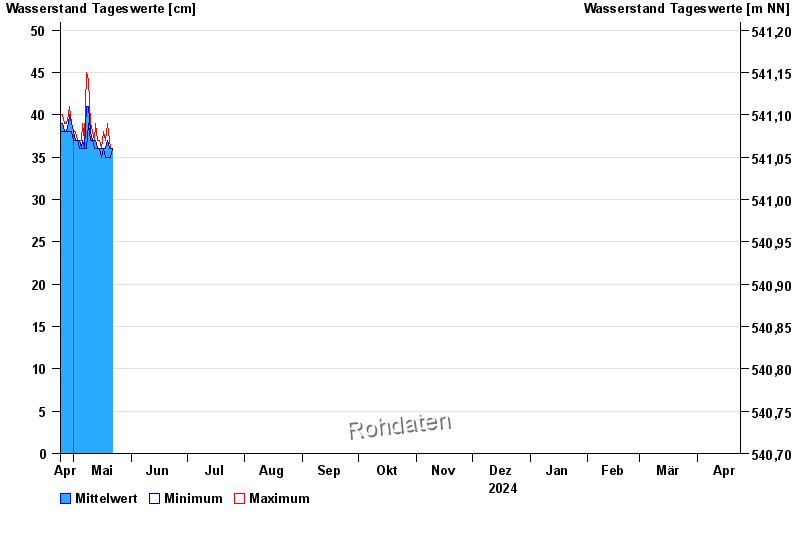
Jahresgrafik Erb / Leitzach
Wasserstand vom 24.04.2024 bis zum 23.04.2025
 Für diesen Pegel sind keine Hochwassermarken hinterlegt.
| Datum | Mittelwert [cm] | Maximum [cm] | Minimum [cm] |
|---|---|---|---|
| 01.06.2024 | 89 | 120 | 47 |
| 31.05.2024 | 47 | 50 | 42 |
| 30.05.2024 | 41 | 50 | 37 |
| 29.05.2024 | 39 | 40 | 38 |
| 28.05.2024 | 41 | 45 | 39 |
| 27.05.2024 | 36 | 38 | 36 |
| 26.05.2024 | 37 | 37 | 36 |
© Bayerisches Landesamt für Umwelt 2024