
- Startseite >
- Flüsse >
- Wasserstand >
- Isar >
- Bad Aibling >
- Jahresgrafik

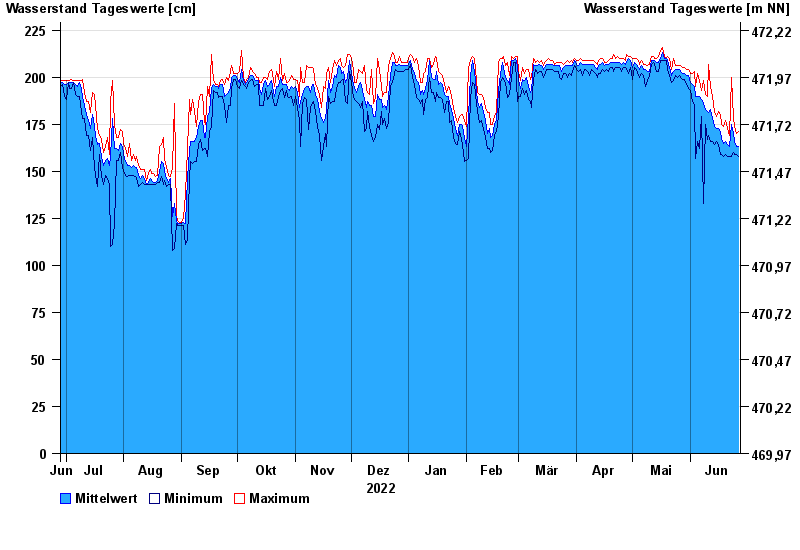
Jahresgrafik Bad Aibling / Triftbach linker Mühlkanal
Wasserstand vom 28.06.2022 bis zum 27.06.2023
 Für diesen Pegel sind keine Hochwassermarken hinterlegt.
| Datum | Mittelwert [cm] | Maximum [cm] | Minimum [cm] |
|---|---|---|---|
| 27.06.2023 | 163 | 171 | 158 |
| 26.06.2023 | 163 | 170 | 159 |
| 25.06.2023 | 166 | 174 | 159 |
| 24.06.2023 | 170 | 178 | 160 |
| 23.06.2023 | 175 | 200 | 158 |
| 22.06.2023 | 163 | 169 | 158 |
| 21.06.2023 | 164 | 173 | 158 |
© Bayerisches Landesamt für Umwelt 2024