
- Startseite >
- Flüsse >
- Wasserstand >
- Isar >
- Bad Aibling >
- Jahresgrafik

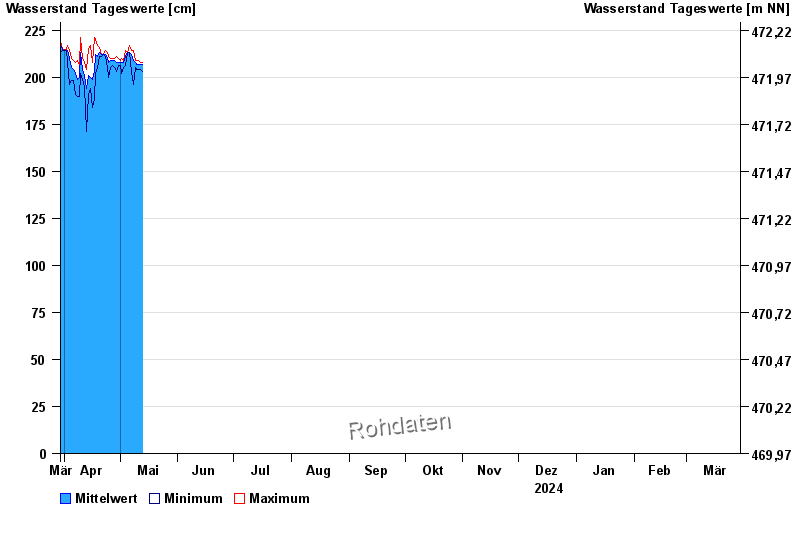
Jahresgrafik Bad Aibling / Triftbach linker Mühlkanal
Wasserstand vom 30.03.2024 bis zum 29.03.2025
 Für diesen Pegel sind keine Hochwassermarken hinterlegt.
| Datum | Mittelwert [cm] | Maximum [cm] | Minimum [cm] |
|---|---|---|---|
| 05.06.2024 | 207 | 209 | 203 |
| 04.06.2024 | 209 | 234 | 189 |
| 03.06.2024 | 218 | 248 | 201 |
| 02.06.2024 | 202 | 205 | 198 |
| 01.06.2024 | 206 | 210 | 200 |
| 31.05.2024 | 203 | 204 | 201 |
| 30.05.2024 | 203 | 204 | 201 |
© Bayerisches Landesamt für Umwelt 2024