
- Startseite >
- Flüsse >
- Wasserstand >
- Isar >
- Bad Aibling >
- Jahresgrafik

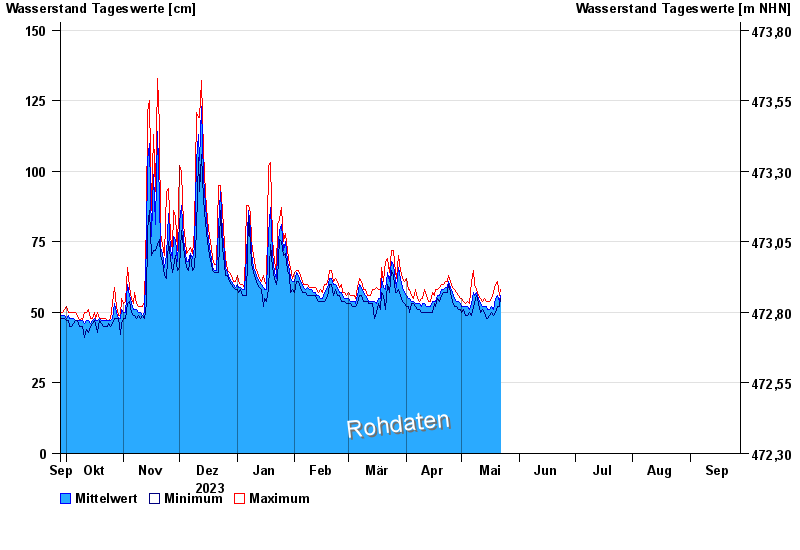
Jahresgrafik Bad Aibling / Glonn
Wasserstand vom 28.09.2023 bis zum 27.09.2024
- Hochwassergefahrenfläche HQ100 290 cm
| Datum | Mittelwert [cm] | Maximum [cm] | Minimum [cm] |
|---|---|---|---|
| 16.06.2024 | 62 | 62 | 62 |
| 15.06.2024 | 61 | 63 | 60 |
| 14.06.2024 | 63 | 65 | 62 |
| 13.06.2024 | 66 | 69 | 63 |
| 12.06.2024 | 72 | 76 | 65 |
| 11.06.2024 | 82 | 93 | 76 |
| 10.06.2024 | 106 | 114 | 83 |
© Bayerisches Landesamt für Umwelt 2024