
- Startseite >
- Flüsse >
- Wasserstand >
- Isar >
- Bad Aibling >
- Jahresgrafik

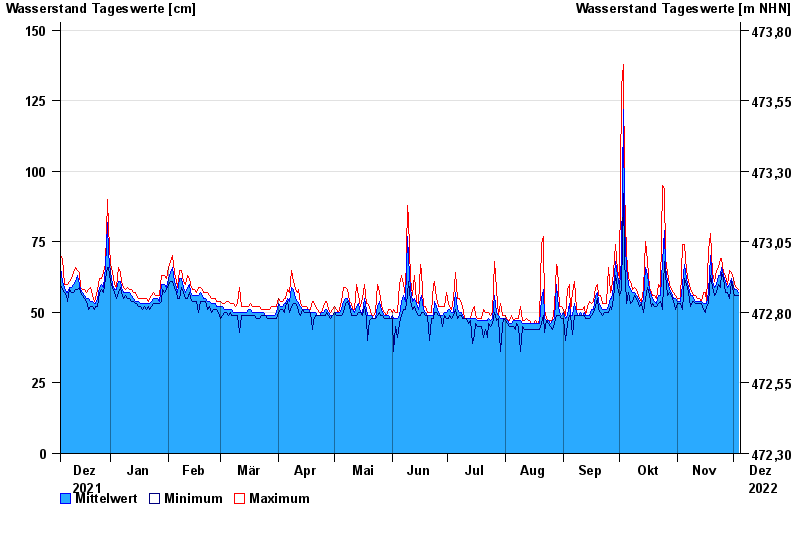
Jahresgrafik Bad Aibling / Glonn
Wasserstand vom 05.12.2021 bis zum 04.12.2022
 Für diesen Pegel sind keine Hochwassermarken hinterlegt.
| Datum | Mittelwert [cm] | Maximum [cm] | Minimum [cm] |
|---|---|---|---|
| 04.12.2022 | 57 | 58 | 56 |
| 03.12.2022 | 58 | 59 | 56 |
| 02.12.2022 | 58 | 60 | 56 |
| 01.12.2022 | 59 | 62 | 57 |
| 30.11.2022 | 62 | 64 | 61 |
| 29.11.2022 | 60 | 65 | 55 |
| 28.11.2022 | 59 | 60 | 57 |
© Bayerisches Landesamt für Umwelt 2024