
- Startseite >
- Flüsse >
- Wasserstand >
- Isar >
- Au b. Bad Aibling >
- Jahresgrafik

Jahresgrafik Au b. Bad Aibling / Aubach
Wasserstand vom 28.04.2024 bis zum 27.04.2025
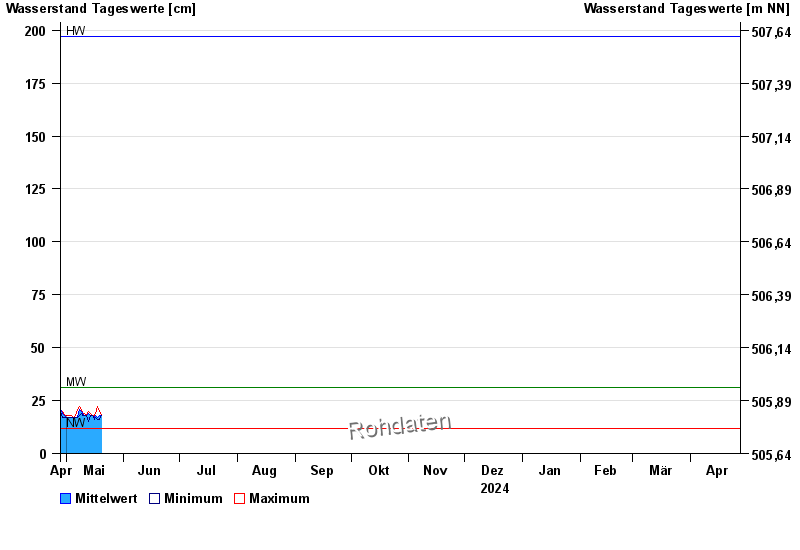
| Datum | Mittelwert [cm] | Maximum [cm] | Minimum [cm] |
|---|---|---|---|
| 08.05.2024 | 20 | 22 | 18 |
| 07.05.2024 | 17 | 21 | 17 |
| 06.05.2024 | 17 | 18 | 17 |
| 05.05.2024 | 17 | 17 | 17 |
| 04.05.2024 | 17 | 18 | 17 |
| 03.05.2024 | 17 | 18 | 17 |
| 02.05.2024 | 17 | 18 | 17 |
© Bayerisches Landesamt für Umwelt 2024