
- Startseite >
- Flüsse >
- Wasserstand >
- Inn >
- Valley >
- Jahresgrafik

Jahresgrafik Valley / Mangfall
Wasserstand vom 21.04.2024 bis zum 20.04.2025
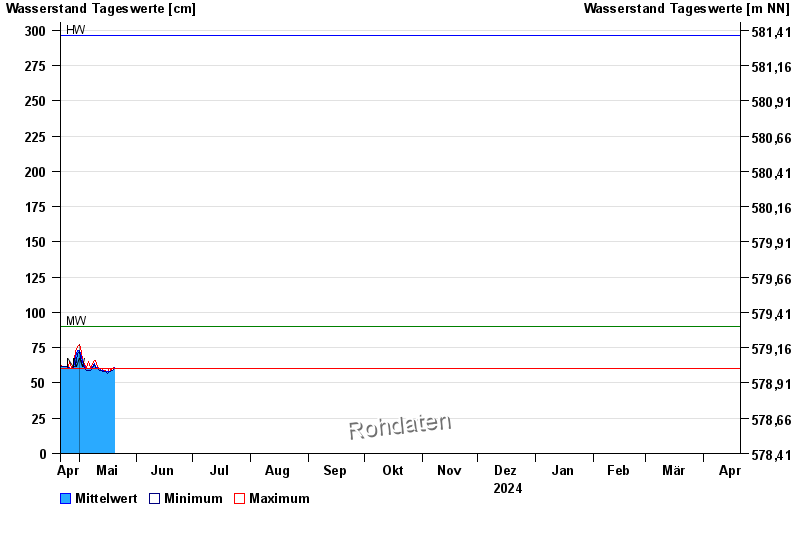
| Datum | Mittelwert [cm] | Maximum [cm] | Minimum [cm] |
|---|---|---|---|
| 01.06.2024 | 119 | 140 | 81 |
| 31.05.2024 | 75 | 85 | 66 |
| 30.05.2024 | 65 | 74 | 62 |
| 29.05.2024 | 63 | 65 | 62 |
| 28.05.2024 | 65 | 68 | 62 |
| 27.05.2024 | 59 | 61 | 59 |
| 26.05.2024 | 60 | 61 | 60 |
© Bayerisches Landesamt für Umwelt 2024